PPOP Growth Picks Up in Q1FY27, with PSBs Outpacing PVBs by CareEdge Ratings

Synopsis
• Pre-provision operating profit (PPOP) of select Scheduled Commercial Banks (SCBs) grew 7.7% year-on-year (y-o-y) and 5.1% sequentially in Q1FY27. Net interest income carried the increase, but it grew mainly on balance sheet expansion rather than on margins.
* Public Sector Banks (PSBs) grew PPOP at more than twice the pace of Private Sector Banks (PVBs) on y-o-y growth. The advantage came from outside the loan book. PSBs hold much larger investment portfolios, and as securities matured, they were reinvested at higher yields, lifting overall asset yields even as loan yields fell. PVBs, with more of the balance sheet in advances, had no equivalent offset and saw margins compress.
* Treasury remained a drag, though a brief retracement in bond yields towards the close of the quarter allowed some banks to realise gains that had not been anticipated at the outset.
• The composition of non-interest income has been recast over the past year. Fee-based income now accounts for close to three-fourths of other income, against roughly half a year ago, while treasury has receded to a modest share.
• Operating expense growth was contained at 3.9% y-o-y and near-flat sequentially, leading to a sequential improvement in the cost-to-income ratio. The restraint looks temporary, with banks committed to branch expansion, specialist hiring and technology spending through the year.
• Net profit grew at roughly three times the pace of PPOP, as provisions fell 10%. That gap cannot persist. Asset quality has improved, but not uniformly; several banks have declined to lower credit cost guidance despite running below it, and the move to expected credit loss (ECL) provisioning will absorb part of the cushion.
• PPOP growth is expected to slow down from current levels. Future margin improvement will depend on whether lower funding costs also benefit the larger private banks. With treasury income remaining weak and provision costs nearing their floor, future earnings growth will rely primarily on stronger fee income and continued cost discipline.
Operating Profits Gather Pace, Led by PSBs
Figure 1: PPOP Growth Led by PSBs (Rs Lakh Crore)

• PPOP growth accelerated in Q1FY27; meanwhile, the gap between the two bank groups widened. PSBs grew at more than twice the pace of PVBs.
• The gap runs through all three parts of operating profit. PSB net interest income rose 12.0% against 9.6% at PVBs. PSB operating costs grew just 1.6%, while PVB costs rose 5.2%. Other income fell at both, with treasury the main drag, down about two-thirds at PVBs against just under half at PSBs.
• Within both groups, the smaller banks grew faster. Other PSBs grew 15.7% against 10.3% for Large PSBs, and Other PVBs grew 9.4% against 4.2% for Large PVBs. These banks had cut high-cost bulk deposits earlier in the cycle, so their funding costs began easing sooner.
• Sequentially, SCB PPOP rose 5.1%, the strongest of the past four quarters. The order reverses on this basis, with PVBs up 6.1% against 2.9% for PSBs. PVB operating costs fell 0.6% during the quarter while PSB costs rose 3.6%. Treasury income also recovered from a low Q4FY26 base, rising 77% for SCBs.
• Banks are no longer chasing loan growth alone. Several have shifted their mix towards secured lending, mortgages, gold loans, and better-rated corporates, and away from unsecured cards and microfinance. One PSB grew advances 27% but held guidance at 18% and now tracks profitability branch by branch. A mid-sized private bank said its strong first quarter reflects front-loading and should not be read across FY27. The move to secured lending should steady margins but will limit headline loan growth.
Figure 2: Cost-to-Income Ratio (%)

• The cost-to-income ratio worsened for SCBs over the year but improved for PSBs, who now run only three percentage points above private banks, the narrowest gap in the current series
• Both the SCB and PVB readings are affected by the one-off gain in the Q1FY26 base, which inflated income and held the ratio down that quarter. Excluding it, the SCB ratio was 45.9% in Q1FY26, so it improved by close to a percentage point over the year rather than worsening. PVBs were flat on the same basis, against an apparent rise of over six per cent.
• The ratio depends on whether income grows faster than costs. PSB net total income rose 7.6% y-o-y while operating expenses rose just 1.6%, which is why their ratio fell almost three percentage points. At PVBs, both lines grew 5.2% on an adjusted basis, leaving the ratio unchanged. On figures, PVB income fell 1.0% while costs rose 5.2%, which produced the apparent slip.
• Sequentially, the SCB ratio improved to 45.0% from 46.0%, a second straight quarter of improvement. PVBs gained most, down to 43.9% from 45.5%, helped by a 0.6% fall in operating expenses during the quarter. PSBs were broadly flat as costs rose 3.6% against income growth of 3.2%. The spread within private banks remains wide, with Large PVBs at 40.2% against 54.1% for the smaller ones.
• The cost restraint this quarter is a pause rather than a trend. Branches opened over the past five years are now maturing at the larger private banks, which should lift productivity. But banks are adding new branches at pace. One PSB is also adding a thousand credit officers in October. Costs should rise through FY27, and this quarter's improvement owes more to income growth than to lasting cost control.
Total Income (Rs. Lakh, Cr.)
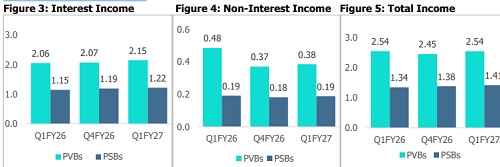
• Interest income kept growing through the year while non-interest income contracted, and the two almost cancelled out. That is why total income barely moved. The contraction is overstated by the one-off gain in the Q1FY26 base; excluding it, non-interest income fell 3.6% rather than 15.2%, and total income grew 3.9% rather than 1.7%.
• PSBs grew faster than PVBs on both lines. Interest income rose 6.5% at PSBs against 4.6% at PVBs y-o-y, helped by stronger credit growth. The gap on non-interest income was wider still, as treasury earnings fell by about two-thirds at PVBs against just under half at PSBs.
• Sequentially, income recovered across the board, with interest income and non-interest income each rising a little over 3%. The pickup in non-interest income came off a low Q4FY26 base and was led by treasury
Figure 6: NIM Movement (%)

• Margins moved in opposite directions over the year. PSB NIM improved while PVB NIM declined, leaving the SCB aggregate marginally lower.
• The pressure came from the asset side. Repo-linked loans repriced quickly as earlier policy cuts passed through, while deposits reprice only on maturity. Lending yields therefore fell faster than funding costs at both groups, and spreads narrowed by about 22 bps at PSBs and 16 bps at PVBs.
• PSB margins still held up, and the reason sits outside the loan book. PSBs carry much larger investment portfolios, and as securities matured, they were reinvested at higher yields. That supported their overall asset yield even as loan yields fell. PVBs, with more of the balance sheet in advances, had no such support.
• Sequentially, the pattern was the same but milder, with PSBs gaining and PVBs losing a few basis points. Deposit costs are still falling, down 31 bps at PSBs and 45 bps at PVBs over the year, but the sequential decline has narrowed to single digits. Most of the repricing benefit has now been taken.
• Margins should stay broadly stable from here. Banks that cut bulk deposits early have already captured most of the funding-cost relief, while several larger private banks expect theirs from Q2FY27 as high-cost liabilities are retired. Competition for both deposits and credit remains intense, which will cap any expansion.
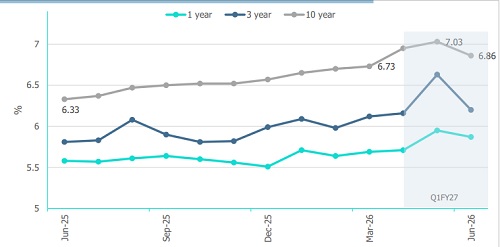
Figure 7: Yield on Residual Maturity of Government of India Securities (%)
Above views are of the author and not of the website kindly read disclaimer