Economics : Why India is resilient amid West Asia crisis: 5 anchors by Elara Capital

India’s sustained economic expansion amid global headwinds has prompted close examination of the structural and policy factors that underpin its growth resilience. While many emerging economies have faced sharper slowdowns amid crude oil price shock-led external sector vulnerability, tighter financial conditions, and geopolitical uncertainty, India has posted robust GDP growth in Q1FY27 and most high frequency indicators so far have held up well.
High-frequency indicators, including Q1FY27 earnings, corroborated that the economy’s fundamental strength was intact despite external shocks and methodological controversies over the new series. Sales for Elara Universe grew 19.7% YoY and PAT rose 6.4%, while ex-OMC PAT grew 18.6% versus ~14% expected.
Underlying demand was healthy, with strong uptick in Auto and FMCG volume growth and improving credit demand. In essence, the resilience of the growth trajectory, rather than any single statistical debate, is the more meaningful takeaway.
In this note, we explore five key anchors behind India’s current economic resilience despite the current oil price shock
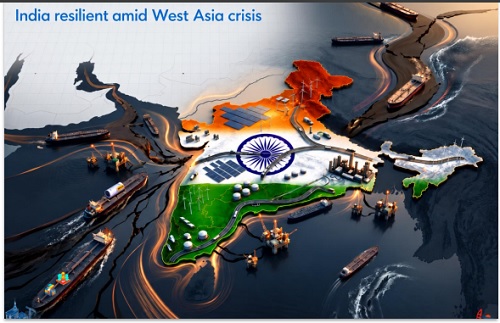
Exhibit 1: Indian economy’s resilience to current oil shock– Five anchors
#1: USD 100/bl in 2014 ≠ USD 100/bl in 2026
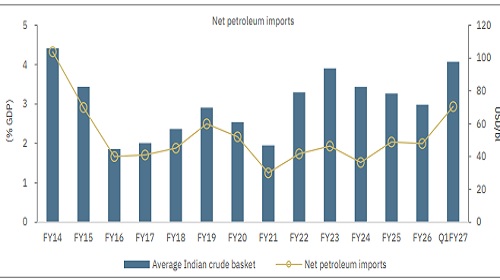
Energy intensity of GDP in India has declined in the past few years, reflecting technological improvements and structural shift toward services (lower energy intensity than industry). Consumption of petroleum products in India since FY14 ( the last time Indian crude basket was consistently above USD 100/bl) has compounded at a CAGR of 3.35% vs. nominal GDP growth of 9.3%. in FY14 – last time when Indian crude oil basket prices hit an average of USD 105/bl, gross crude imports and net crude imports were 7.73% and 4.32% of India’s GDP. In Q1FY27, they stood at a 5.23% and 2.93% respectively. Overall energy intensity of GDP has fallen substantially: ~15% decline between 2014 and 2022. The oil intensity decline has reduced relative vulnerability to oil-price shocks although physical dependence continues.
Exhibit 2: India’s energy intensity of GDP is falling, thus reducing vulnerability to oil shocks
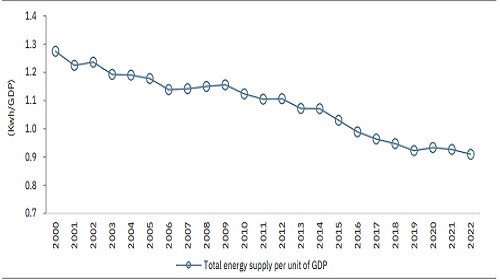
Exhibit 3: Despite crude oil at USD 100/bl, gross crude oil import as % of GDP lower by 30% vs FY14
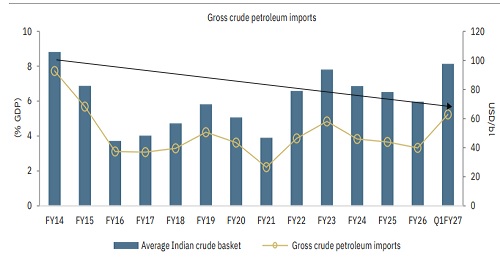
Exhibit 4: In FY14, with crude oil at >USD 100/bl, net crude imports were 4.32% of GDP vs. 2.91% today
 ???????
Above views are of the author and not of the website kindly read disclaimer