Pan India Residential Market Viewpoints Q3 2026 by Anarock
Housing sales rise 3% year - on - year in Q3 2026; New supply climbs 18% annually as end - user demand rebuilds market momentum
Q3 2026 marked a clear turn in market momentum. Housing sales across the Top 7 cities rose 3% year - on - year to approximately 1,00,200 units worth about INR 1.55 lakh crore, as end - user buyers who had held back in the previous quarter returned to close purchases. The earlier moderation now looks cyclical rather than structural. Developer confidence strengthened further, with new residential launches rising 18% to nearly 1.14 lakh units. The Mumbai Metropolitan Region (MMR), Hyderabad, and Pune led residential activity, accounting for 66% of new residential launches, while MMR, Bengaluru, and Pune accounted for 64% of sales.
Beyond the quarterly numbers, two shifts stand out. The supply mix broadened sharply, with homes priced above INR 2.5 crore easing to 14% of new residential launches, while the affordable segment (below INR 40 lakh) more than doubled its share to 14% of total supply. The change reflects developers widening their buyer base after several quarters of premium -led pipelines. At the same time, residential prices held firm, rising 7% year - on - year and 1% quarter - on - quarter, supported by steady end - user demand, stable borrowing costs, and developers' ability to sustain pricing across a broader product range.
The medium -term outlook has improved. Sales crossed 1 lakh units after reduced sales in Q2 2026, and every one of the seven cities recorded sequential growth, pointing to a recovery that is broad - based rather than concentrated in one or two markets. Festive sentiment, stable borrowing costs, and a healthy launch pipeline should carry this momentum into the closing quarter, although higher prices are likely to keep buyers selective.
The supply and absorption balance still needs watching. Available inventory closed the quarter at approximately 6,30,600 units, 12% higher than a year ago, as new residential launches ran ahead of sales. The gap did narrow to roughly 14,100 units from 15,300, and the overhang held at about 19 months. Hyderabad, at 28 months, is where launch pacing is likely to matter most through Q4 2026.
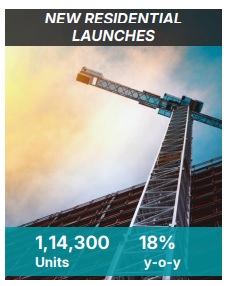
NEW RESIDENTIAL LAUNCHES
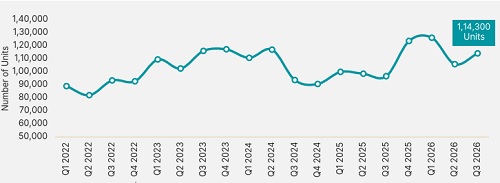
The residential market across Top 7 cities in India recorded approximately 1,14,300 residential unit launches in Q3 2026 – an 18% year - on - year increase over the approximately 96,700 units launched in Q3 2025, and an 8% quarterly rise from the 1,06,000 units recorded in Q2 2026. The rebound reflects developers releasing pipelines held back through the previous quarter, as recovering buyer enquiries and steadier sentiment restored confidence in near -term absorption.
The key cities driving new residential launches were MMR, Hyderabad, Pune, Bengaluru, and the National Capital Region (NCR), collectively accounting for approximately 91% of total supply additions. In terms of budget segmentation, supply widened beyond the premium end, with homes priced above INR 80 lakh accounting for approximately 69% of new residential launches in Q3 2026.
SALES
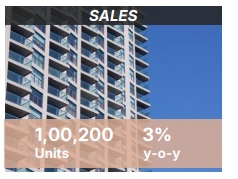
The Top 7 cities registered sales of approximately 1,00,200 units in Q3 2026 – 10% higher than the 90,700 units sold in Q2 2026 and 3% above the approximately 97,100 units recorded in Q3 2025. Sales value reached approximately INR 1.55 lakh crore, 13% above Q2 2026 and 2% above Q3 2025. Sales grew despite continuing geopolitical uncertainty and rising prices, carried by end - use buyers closing purchases deferred in the previous quarter.
MMR, Bengaluru, and Pune together accounted for approximately 64% of total housing sales in Q3 2026, while NCR and Hyderabad collectively contributed a further 27% share.
AVAILABLE INVENTORY
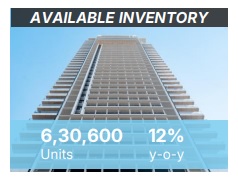
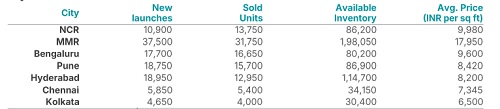
Available inventory across the Top 7 cities stood at approximately 6,30,600 units by Q3 2026 end – a 2% quarterly increase from approximately 6,16,500 units at Q2 2026 end and a 12% year - on - year rise from approximately 5,61,750 units recorded at Q3 2025 end. The slower build - up reflects absorption closing much of the gap with new supply this quarter. MMR, Hyderabad, and NCR together accounted for approximately 63% of total available housing inventory. Table 1 summarises the city -level figures.
Above views are of the author and not of the website kindly read disclaimer