Nifty Trades in Narrow Range, Ends Slightly Lower - ICICI Direct Ltd

Nifty : 22603
Technical Outlook
Day that was ..
Following a two-day upward surge, the Nifty has taken a breather, settling at 22,603, down 173 points (-0.75%). The correction followed the Reserve Bank of India’s (RBI) 25 basis point rate hike, which tempered investor sentiment. Despite benchmark’s decline, the smallcap index outperformed, gaining 0.3%. Sectoral dynamics painted a mixed picture. While PSU banks held steady and displayed relative resilience, key cyclical sectors such as metals, real estate, and automobiles lagged.
Technical Outlook :
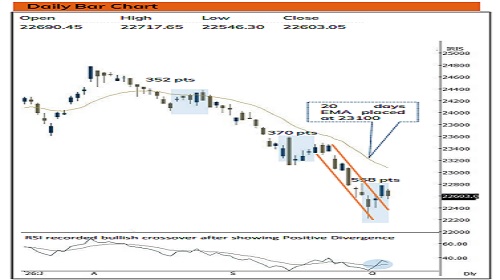
• After a subdued opening, the Nifty oscillated within a narrow 170-point range throughout the trading session, ultimately closing in a small bearish candle. This consolidation follows a sharp 550- point rally over the previous two sessions
• The index recently broke out of a downward-sloping trendline, signaling a potential pause in the broader upward momentum. Notably, the the Augurecovery from the 1st Oct low of 22,217 has been the strongest pullback since st peak of 24,774, surpassing the ~350-point rebounds observed during the two prior relief rallies, indicating early sign of revival.
• From a structural standpoint, the market has weathered an eightweek decline, the longest consecutive downturn since 2001, before finding support at the long-term 200-week EMA, coinciding with a rising long-term trendline. This confluence of technical support, coupled with oversold conditions, has created a favorable risk-reward setup for large-caps ahead of the Q2 earnings season. Thereby focus should be on accumulating quality stocks backed by strong earnings. A decisive close above the previous week’s high of 23,100 could serve as a pivotal signal for a meaningful trend reversal.
• On the momentum indicator front, the daily RSI is showing signs of recovery, gradually regaining lost ground after witnessing positive divergence. Meanwhile, the weekly stochastic oscillator is attempting a bullish crossover in oversold conditions, a promising early indication of a potential reversal.
Key Monitorables
• Kick-off of Q2 Corporate Earnings Season
• US 10-Year Treasury Yields ,Brent Crude Trajectory
Intraday Rational :
Trend – Supportive efforts emerging around 200 weeks EMA
Levels – Buy around 61.8% retracement of 4 days range
Nifty Bank : 55056
Technical Outlook
Day that was :
Bank Nifty ended the day eventful day on flat note, at 55056 down 0.13% on back of mixed global cues.
Technical Outlook :
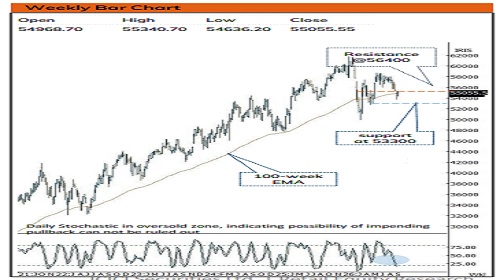
• Bank Nifty started the day with negative opening and thereafter found supportive efforts from 50% retracement of last 3 days up move around 54700. The daily price action formed a high wave like candle with shadows on either side indicating indecisiveness at current levels.
• Going ahead follow through strength beyond 55400 (being last weeks high) would confirm resumption of uptrend and open door towards 56400-56600 levels being 61.8% retracement of current decline(58025- 53785) and 200-day EMA.
• However, failure to do so would result into extended correction wherein strong support is placed around crucial support area of 53300 levels being 61.80% retracement of Apr-Jun rally (49955-58706).
• Among oscillators, weekly stochastics is placed at 21 levels rebounding from oversold territory indicating impending pullback.
• The PSU Bank Index formed bullish engulfing candlestick indicating positive momentum. Going ahead, support is placed at the lower band of past five months consolidation (9095-7809). While oversold placement of daily and weekly stochastic oscillator warrant for selling exhaustion in coming weeks.
• Intraday Rational :
• Trend - Supportive efforts emerged around 80% retracement of June rally (53027-58706)
• Levels: Buy around 61.8% retracement of 4 days range
Please refer disclaimer at https://secure.icicidirect.com/Content/StaticData/Disclaimer.html
SEBI Registration number INZ000183631











.jpg)