

Nifty Smallcap100 Index by InCred Equities
Technical overview:
We released a report on Nifty titled Abhi Nahi Toh Kabhi Nahi on 03rd March 2025 with a recommendation to buy at 21800-22000 levels for a target price of 27000 in 9-12 months. The index has moved in line with expectations and made a fresh life high levels of 26300 and is poised to reach 27000 levels in the coming time. During this period, the large cap stocks have not only witnessed strong gains but also exhibited marked outperformance. We have released multiple reports on the large cap stocks to tap on the potential which have given good gains, however, the smallcap space has been under intense pressure with majority of stocks witnessing deep corrections in the last few months. Our expectations are this underperformance in smallcap index is likely to end and an upside of 20-25 percent can be achieved by December 2026, thus providing wonderful investment opportunities for the long term. Chart 1 shows the long-term structure of Nifty Smallcap100 index. Please note that the overall strength remains same in other smallcap indices, however, Smallcap100 is chosen due to its long price history. The index witnessed a 15- year ascending trendline breakout in 2023 which resulted in a significant upside. The index witnessed a strong price correction in March this year and since then it has been undergoing time correction. Interestingly, the index bounced back sharply after retesting the multiyear breakout implying the worst seems over and it can pick up strong momentum in coming months. RSI has also bounced from strong support zone with early signs of hidden bullish divergence which supports the postulate of a strong upside
Chart 1: Nifty Smallcap100 Index on monthly time frame
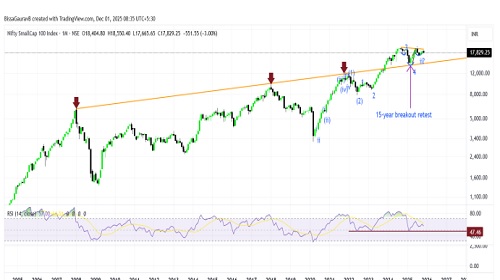
Chart 2: Nifty Smallcap100 Index on weekly time frame
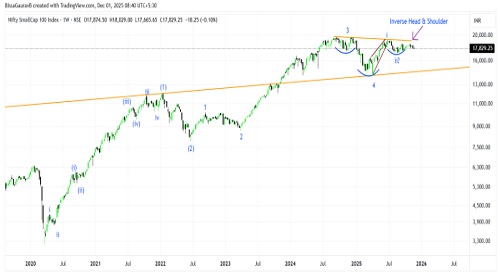
Chart 2 shows Nifty Smallcap100 index in a relatively short time period to understand the internal structure. The index seems to have completed a small wave ii implying it can cross previous life high to complete wave iii. It can move 20-25 percent from current levels to complete the larger wave 5. The index is also forming an inverse head and shoulder pattern with breakout confirmation on close above 19200 levels. The pattern target syncs with the Elliot wave target of 21300-22200 levels
Chart 3: Nifty Midsmlcap400 index on weekly time frame
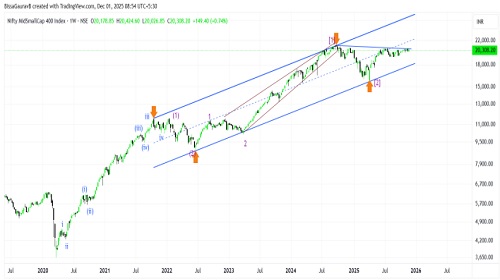
Chart 3 shows the chart of Nifty Midsmallcap400 index to understand the overall sentiment of the broader market. The index is trading in an ascending channel pattern since 2022 and is currently on the verge of a consolidation breakout, which once confirmed can result in a strong upside. The index seems to have completed a smaller wave [2] pattern which supports the overall expectations of 20-25 percent upside in a year.
Chart 4: Nifty Total Market index Renko charts on daily time frame
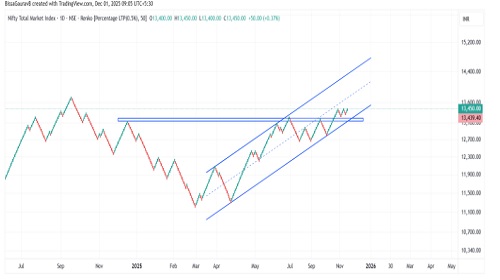
Chart 4 shows the setup of Nifty Total Market index. This is important to study as trends usually remain strong if the overall breadth improves. This index has a blend of largecap, midcap and smallcap stocks. The index has witnessed a smart bounce after retesting a major swing high breakout in 0.5 percent brick size Renko charts suggesting a strong upside in the coming months. While the proportions of the upside may not be as large as smallcap index, a continued upmove in Nifty Total Market index is likely to keep the trend strong going forward.
Above views are of the author and not of the website kindly read disclaimer


.jpg)
More News

Nifty opened with a positive note but witnessed sideway movement in the first hour - Jainam ...


