Nifty opened firm but profit booking led to tight consolidation later - ICICI Direct

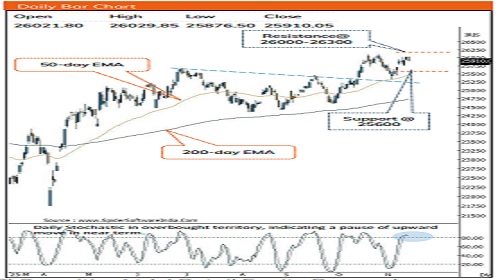
Nifty :25910
Technical Outlook
Day that was…
Indian equity benchmark takes breather tracking muted global cues. Nifty settled the day at 25,910 (-0.40%). Nifty Midcap mirrored the benchmark, to close at 60,822 (-0.59%). Market breadth was in favour of decline with an AD ratio of 1:2, while sectoral momentum stayed broadly negative, led by Realty, IT and Metal which continued to underperform.
Technical Outlook:
* Nifty started the day on a firm note but early profit-booking quickly tempered the momentum, pushing the index into a tight consolidation zone during the latter half. As a result, daily price action formed a sizeable bear candle indicating breather after recent sharp up move.
* Key point to note is that after six sessions ~700 points upmove the daily stochastic oscillator has entered in to overbought zone, that led to profit booking in today’s session. However, index continues to trade in the higher-high-low formation in weekly time-frame, indicating broader structure remains intact. Hence, any decline from hereon should not be construed as negative as index is trading well above its all-key moving average support, indicating near-term bullish view is intact and expect index to gradually resolve higher to retest its all-time high near 26,300 in the coming month. Further, with better-thanexpected Q2 earnings reinforces positive momentum that would drive index higher. Hence, any decline should be used as buying opportunity as strong support is placed at 25600 as it is 61.8% retracement of Sept-Oct rally (24588-26104) coincided with 50 days EMA.
Following observations makes us reiterate our positive stance:
* Bank Nifty: Past 10 sessions decline completely retraced back in just five sessions and clocked a fresh all-time high.
* Midcap: Midcap index challenged Sep-24 high and recorded fresh alltime high. The current up move is backed by improvement in market breadth as currently 71% of Midcap index stocks are trading above their 200 days SMA compared to one month back reading of 64
* Nifty IT vs Nasdaq: Defying the past two decades positive correlation with Nasdaq, the Nifty IT index has seen correction in recent past. Consequently, Nifty IT vs Nasdaq ratio has approached at two decades low. The current pullback in the ratio signifies mean reversion can be seen going ahead wherein Nifty IT would relatively outperform the Nasdaq in coming months
* Global Macros: US Dollar index and Brent crude have been inching downward that augurs well for emerging markets
Key Monitorable for the next week:
* With the Development of India-US tariff negotiations would be key monitorable
Intraday Rational:
* Trend- Sizable bear candle indicates breather after recent up move
* Levels: Buy on declines near 80%of last two days upmove (25815- 26083)
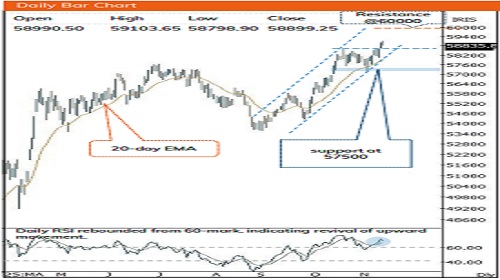
Nifty Bank : 58899
Technical Outlook
Day that was:
The Bank Nifty closed the session with a minor fall to settle at 58,899, down 0.11%. The Nifty Private Bank index has outperformed the benchmark to close flat at 28,407 down 0.03%%.
Technical Outlook:
* Bank Nifty opened the session on a positive note, extending buying momentum until mid-afternoon. However, the index saw noticeable profit booking in the closing hour, trimming intraday gains. The daily price action formed a minor bear candle with shadows on both ends, indicating range bound consolidation after recent up move.
* The index continues to trade above its recent all-time high breakout point coinciding with gap support (58.590), indicating short-term positive view remains intact. Notably, PSU banks remains in firm leadership, marking fresh record highs, while the private bank index is just 1.5% away of its peak, hinting at a potential catch-up move that could further bolster the ongoing uptrend. Thereby, we reiterate our positive stance and expect the index to gradually resolve higher towards our projected target of 60,000 in the coming month.
* On momentum front, with all key moving averages positioned in a northward slope, reflecting a firm bullish structure. Momentum readings further support this setup, as both daily and weekly RSI continue to hold in the bullish band, reinforcing confidence in the breakout. Hence, focus should be on accumulating quality stocks on dips backed by strong earnings as immediate support is placed near 57,500, being 80% retracement of the ongoing advance (57,157–58,962).
* Historically, there have been 17 instances over the past two decades where Bank Nifty, following a decisive breakout above its previous two-month high, delivered double-digit returns within the subsequent four months. In the current setup, the index has once again confirmed a breakout above its prior two-month high and surpassed the previous all-time peak, reaffirming the prevailing bullish structure. This setup indicates a high-probability continuation pattern for sustained upside momentum in the coming months.
* The PSU Bank Index continues to outperform, maintaining a higher-high, higher-low formation for the eleventh-straight week on the back of strong Q2 earnings. In near term, index is witnessing series of healthy consolidation after sharp up move. However, any dip from hereon should not be construed as negative instead capitalized it as buying opportunity in quality stock as strong support is placed near 7,800, aligning with the 38.2% retracement of the latest rally (6,730–8,391).
* Intraday Rational:
* Trend- Higher-High and High Low formation
* Levels Buy on declines near 61.8% retracement of previous two days upmove (58380-59067)
Please refer disclaimer at https://secure.icicidirect.com/Content/StaticData/Disclaimer.html
SEBI Registration number INZ000183631