Nifty Forms Long Bearish Candle, Breaks Key Supports Near 200-Week EMA - ICICI Direct Ltd

Nifty : 22603
Technical Outlook
Day that was ..
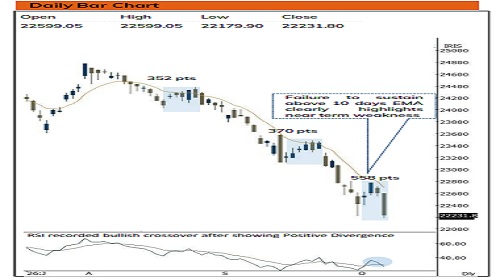
Equity benchmark plunged sharply, surrendering all its previous gains tracking weak global cues amid surge in bond yield and crude oil prices. Nifty settled on a deeply negative note by losing 371 points or 1.64% to close Thursday's session at 22,232. The Nifty Midcap and Smallcap indices witnessed broad-based capitulation to end lower by more than 2% each. Sectorally, Nifty Metal and Realty indices emerged as the primary laggards, declining by over 3%, closely followed by severe selling pressure across Auto, Energy, FMCG, Infra, and Oil & Gas segments. India Vix jumped 10% to settle at 15.3 levels
Technical Outlook :
• Index started the session on a subdued note and continued to drift lower throughout the day as intraday pullbacks were short lived. Consequently, daily price action formed a long bearish candle that decisively sliced through immediate structural supports, indicating a sharp rise in volatility in the vicinity of the 200-week EMA.
• The index failed to capitalise the rally seen during early part of the week. Highlighting point is that despite sharp up move, index failed to sustain above 10 days EMA. Consequently, once again pullback attempt fizzled out, leading to close near Apr-26 lows of 22182. Going ahead, breakdown below this swing low (22182) would result into prolongation of correction wherein strong support is placed at 21700 being Apr-25
• Therefore, a decisive close above 10 days EMA 22700 that coincided with current week’s high 22776 remains a strict prerequisite for pausing the ongoing corrective move.
• The extended ~9-week consecutive decline represents a highly rare and significant technical drawdown, driving key momentum oscillators into deeply oversold conditions (weekly Stochastic is placed at 8). Meanwhile, reading of % stocks of Nifty 500 universe trading above 50 days EMA have approached to their bearish extremes reading of 14%. This prolonged structural correction across momentum and breadth indicators suggests that the market is stretched to its limits and due for a sharp technical pullback once global macro triggers stabilize.
Key Monitorables
• Progress and corporate commentaries of the Q2 Corporate Earnings Season
• US 10-Year Treasury Yields (fluctuating above 5.30%), USDINR Trajectory (inching near 97)
• Brent Crude breaking above $104/bbl
Intraday Rational :
Trend – Lower high lower low indicates corrective bias.
Levels – Sell around 61.8% retracement of Thurdays decline.
Nifty Bank : 54515
Technical Outlook
Day that was :
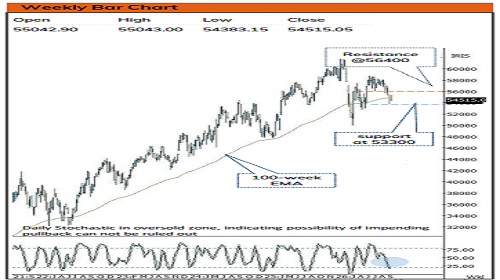
Bank Nifty ended the day Sensex weekly expiry session on negative note, at 54515 down 0.98% on back of weak global cues.
Technical Outlook :
• Bank Nifty started the day with negative opening and continued to remain southward to settle near low point of the day. The daily price action formed a bear candle with lower high lower low indicating corrective bias.
• Bias remains corrective as long as long as Index fail to close above previous session high. Therefore, Going ahead follow through strength beyond 55400 (Two weeks high) would confirm resumption of uptrend and open door towards 56400-56600 levels being 61.8% retracement of current decline(58025-53785) and 200- day EMA.
• However, failure to do so would result into extended correction wherein strong support is placed around crucial support area of 53300 levels being 61.80% retracement of Apr-Jun rally (49955-58706).
• Among oscillators, weekly stochastics is placed at 15 levels rebounding from oversold territory indicating impending pullback.
• The PSU Bank Index formed bear candle with upper shadow indicating breather. Going ahead, support is placed at the lower band of past five months consolidation (9095-7809). While oversold placement of daily and weekly stochastic oscillator warrant for selling exhaustion in coming weeks.
• Intraday Rational :
• Trend - Lower high lower low indicates corrective bias.
• Levels: Buy around 61.8% retracement of 4 days range
Please refer disclaimer at https://secure.icicidirect.com/Content/StaticData/Disclaimer.html
SEBI Registration number INZ000183631