Nifty Fails to Sustain Gap-Up, Stays Range-Bound - ICICI Direct Ltd

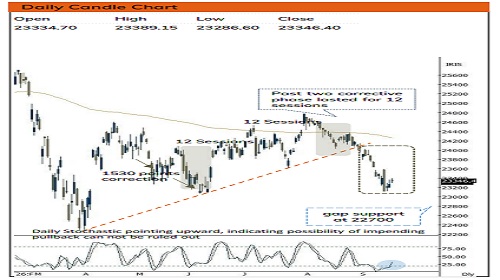
Nifty : 23346
Technical Outlook
Week that was..
The week remained volatile amid elevated crude oil prices, geopolitical risks, and a 25-bps US Federal Reserve rate hike to end flat at 23330. Persistent FII selling continued to weigh on sentiment (cumulative weekly outflows of Rs8,219.23 crore), though robust domestic institutional buying (net inflows of Rs10,212.03 crore) provided strong support, resulting in net institutional inflows of Rs 1,992.80 crore. Easing crude prices toward the end of the week offered relief to domestic equities. Sectorally, Pharma (+0.5%) and FMCG (+1.5%) outperformed, while Capital Goods, Power, Healthcare, Auto, IT, and Realty lagged for the week.
Technical Outlook :
• Index started the week with a gap-up opening but failed to sustain at higher levels, closing lower on Tuesday and remaining confined within Tuesday's high-low range for the rest of the week. As a result, weekly price action formed a bear candle carrying a lower high-low, indicating a prolonged corrective bias. Structurally, over the past six months, trading activity has been confined within the entire March month’s range (22200– 25000). Such prolonged range contractions systematically set the stage for a major directional move; hence, as long as the index holds the swing low of 22700, the buy-on-dips structure remains intact.
• In the coming week, sustaining above 23500 is a prerequisite to confirm a structural pause in the corrective leg and open an extended pullback toward 24000; else, price action is likely to remain confined to a 23100– 23500 consolidation band.
• Among momentum indicators, the daily RSI is leveling out near the 22 zone, historically marking an inflection point where aggressive selling pressure exhausts. Simultaneously, the weekly Stochastic oscillator has plunged into deep oversold territory (placed at 13), indicating stretched downside momentum ripe for a potential pullback rally.
• Following a three-week breather, Nifty Midcap and Smallcap indices retested their 20-month consolidation breakout, with strong buying demand emerging around key moving averages. Broader markets maintained relative resilience versus Nifty, though sectoral divergence remains high (over six months, Realty +32.55%, MidSmall Healthcare +29.39%, Healthcare +26.51%, and Pharma +25.95% outperformed, while FMCG +0.93%, IT +1.35%, Oil & Gas +3.46%, and PSU Bank +5.97% lagged).
• On the commodity front, Crude Oil ended the week 1% lower. Lack of follow-through strength in crude above last week’s high ($110) could trigger a technical pullback rally in Nifty
• Key Monitorable :
1. Geopolitical developments and energy-supply risks
2. Crude oil trajectory and global inflation expectations (cool-off in crude combined with Rupee depreciation could provide cushion)
3. US yields, dollar strength, and emerging-market flows 4. Relative strength in Bank Nifty and resilience in broader markets
Intraday Rational :
• Trend – Facing resistance around last 2 days identical highs
• Levels – Sell around Fridays high
Nifty Bank : 56358
Technical Outlook
Week that was :
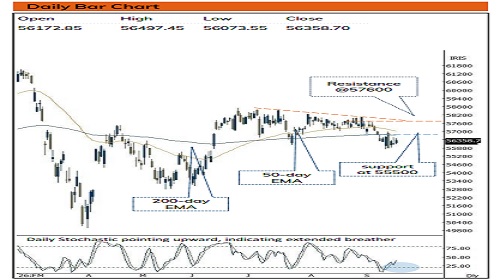
Bank Nifty ended the week on negative note, at 56358 down 0.44% on back of mixed global cues.
Technical Outlook :
• Index started the week with a gap-up opening but failed to sustain at higher levels, closing lower on Tuesday and remaining confined within Tuesday's high-low range for the rest of the week. As a result, weekly price action formed a Inside bar candle, indicating a prolonged consolidation.
• Bank Nifty has relatively outperformed in current corrective phase. It remained largely with Tuesdays bear candle range indicating extended consolidation. Immediate support is placed around 55700-55800 support zone being 50% retracement of May-June rally (52783-58706). Meanwhile, a decisive close above the previous session high of 56570 is required, which has remained elusive for the past seven sessions to confirm a sustained recovery and open the door for a potential pullback towards 57600 being 80% retracement of current decline(58025-55700).
• Sustainability below the same would result into extension of corrective bias towards 55500, representing a 38% retracement of the April–June rally (46,935–58,706).
• The PSU Bank Index formed hammer like candle closing above its 52-week EMA, indicating supportive efforts at lower levels. Going ahead, holding 8150 will lead to pullback towards 8600 levels being 61.8% retracement of current decline.
• Intraday Rational :
• Trend - Prolongation of consolidation around 52 weeks EMA
• Levels: Buy around 80% retracement of last 2 days range
Please refer disclaimer at https://secure.icicidirect.com/Content/StaticData/Disclaimer.html
SEBI Registration number INZ000183631