Nifty Fades After Early High, Slips Toward 22600 - ICICI Direct Ltd

Nifty : 22716
Technical Outlook
Day that was ..
Nifty pared initial gains and settled the volatile session at 22,620, down 96 points. However, market breadth turned flat as small cap gained 0.2%. Sectorally, Realty and Cement relatively outperformed while the primary laggards dragging down the performance were Metals and Pharma.
Technical Outlook :
• Amidst volatile session, Nifty initially surpassed last sessions high of 22753. However, lack of follow through strength dragged index around 22600 zone. Consequently, daily price action formed a bear candle with long upper shadow, highlighting continuation of corrective bias
• The inability to sustain above yesterday’s high indicates that followthrough buying is yet to emerge in Nifty, although the defence of yesterday’s low and the rising trendline keeps the immediate support structure intact. With the seven-week correction extending further amid oversold conditions, we expect the corrective bias to witness an intermediate pause, supported by the following technical factors:
• Bank Nifty outperformed Nifty and witnessed follow-through buying after yesterday’s hammer formation, subsequently closing above yesterday’s high. The relative strength in the banking benchmark provides supportive confirmation to the Nifty as it carries 35% weightage in Nifty.
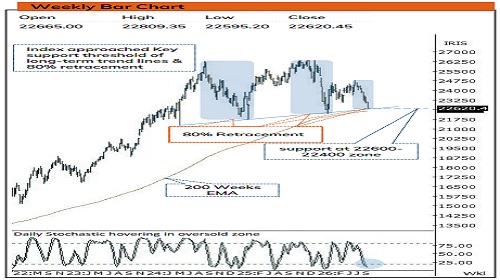
• Over the last two years, Nifty has witnessed two major corrective phases (September 2024 and January 2026) where declines were arrested around the 80% Fibonacci retracement of the preceding rally. The ongoing correction marks the third such instance, with the index once again testing the 80% retracement zone of its prevailing up move (22,182–24,774). This zone coincides with the rising trendline and 200- week EMA around 22,400, creating a strong support confluence.
• Around 81% of Nifty 500 stocks are trading below their 50-day SMA, indicating significantly deteriorated breadth and a stretched market condition, which supports the possibility of a technical rebound.
• The ongoing correction has now extended to seven consecutive weeks. Historically, corrections lasting beyond six consecutive weeks have been relatively infrequent, with such extended declines eventually witnessing a recovery in momentum from bearish extremes.
• Daily RSI remains around 25 with positive divergence, while the weekly Stochastic oscillator remains in the oversold zone around 9. The combination indicates narrowing downward momentum and supports the possibility of an intermediate technical pullback.
• For a meaningful pullback to materialise, Nifty needs to reclaim and close above the previous week’s high of 23,080, which it has failed to surpass for the past seven weeks. A close above this level would provide confirmation of an intermediate recovery.
Intraday Rational :
Trend – Lack of follow through strength indicates continuation of corrective bias
Levels – Sell around 61,8% retracement of Wednesdays range
Nifty Bank : 54633
Technical Outlook
Day that was :
Bank Nifty ended the day on positive note, at 54633 up 0.7% on back of mixed global cues.
Technical Outlook :
• Bank Nifty started the day with negative opening thereafter remained northward and retraced almost 80% of last two days decline. The daily price action formed a bull candle with higher high higher low indicating buying demand from lower levels.
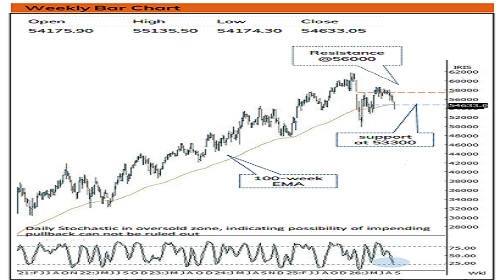
• Index has closed above its previous session high after 6 sessions indicating pause in corrective bias. Going ahead follow through strength beyond 55400 would confirm resumption of uptrend and open door towards 56000 being 200-day EMA coinciding with 61.8% retracement of current decline(58025-53785).Failure to do so would result into extended correction wherein strong support is placed around crucial support area of 53300 levels being 61.80% retracement of Apr-Jun rally (49955-58706).
• Among oscillators, Stochastics is placed at 18 levels rebounding from oversold territory indicating impending pullback.
• The PSU Bank Index formed inverted hammer like candle with higher high higher low indicating. Going ahead, support is placed at the lower band of past five months consolidation (9095-7809). While oversold placement of daily and weekly stochastic oscillator warrant for selling exhaustion in coming weeks.
• Intraday Rational :
• Trend - Hammer candle at key retracement support
• Levels: Sell around 61.8% retracement of Wednesdays range
Please refer disclaimer at https://secure.icicidirect.com/Content/StaticData/Disclaimer.html
SEBI Registration number INZ000183631