Nifty & BankNifty Weekly Outlook 19th October 2025 by Choice Broking Ltd

Nifty
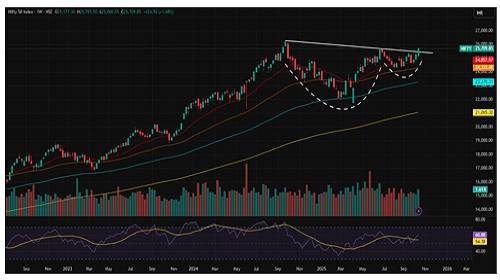
The Nifty index closed at 25,709.85, registering a 1.68% gain over the previous week’s close. The weekly chart reflects a sideways-to-bullish setup, as the index managed to hold firmly above the 25,500 mark, indicating a bullish outlook in the near term.
This week, a strong bullish candle was formed, also giving a breakout of the Cup & Handle formation, indicating renewed strength in the index. The price action reflects a sideways-to-bullish momentum, suggesting a buy-on-dips approach. The index has managed to hold onto its gains, and a sustained hold above the 25,500 mark will be crucial for further upside movement.
On the weekly timeframe, Nifty is trading above all its key Exponential Moving Averages (EMAs), including the short-term (20-week), medium-term (50-week), and long-term (200-week) EMAs. This alignment indicates a strong underlying uptrend and suggests that the index is well-supported on dips, with bullish momentum likely to continue in the near term. The Relative Strength Index (RSI) stands at 60.88, showing a reversal towards the upside, indicating strengthening momentum. The index remains in a healthy structure, and a sustained hold above crucial levels could reignite upward momentum in the coming sessions.
In terms of levels, Nifty has immediate support at 25,500 and 25,300, which could offer strong buying opportunities for traders on dips. On the upside, resistance is seen at 25,800 and 26,000, with the latter acting as a key hurdle. A sustained breakout above 25,800 could trigger a bullish rally, potentially targeting 26,000 and 26,300 in the coming weeks.
The India VIX surged by 6.99% to close at 11.6250, indicating a slight rise in market volatility. In the derivatives segment, the maximum Call Open Interest (OI) is concentrated at the 25,800 and 26,000 strike levels, suggesting strong resistance at higher zones. On the downside, the maximum Put Open Interest is seen at the 25,500 and 25,300 strikes, highlighting strong support levels. Overall, the setup indicates a sideways-to-bullish momentum with a positive bias as long as the index holds above key support levels.
Support: 25500 - 25300
Resistance: 25800-26000
Bias: Sideways to Bullish
Bank Nifty
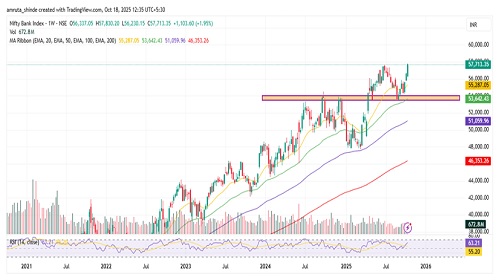
Bank Nifty ended the week on a strong note, closing at 57,713 after rising nearly 1,103 points. The index displayed notable strength by surpassing the crucial 57,500 level and recording its third consecutive weekly gain. Earlier, it broke out of the 53,500–54,000 resistance zone and later retested this area, which has now turned into a solid support base, confirming a successful breakout retest. The move above the recent swing high of 57,628 further validates the ongoing bullish momentum. On the daily timeframe, Bank Nifty has also broken out of a rounding bottom pattern, indicating the potential for a sustained uptrend.
If selling pressure re-emerges and the index decisively slips below 57,500, it could trigger a correction towards 57,000 and 56,850. On the upside, immediate resistance is placed at 58,000, followed by 58,300 and 58,683.
Technical indicators reflect a cautiously optimistic outlook. The RSI on the weekly chart, currently at 63.21 and trending higher, signals improving momentum. Moreover, the index is trading above its 20-day, 50-day, and 200-day EMAs, highlighting a supportive structure for the continuation of the uptrend. A decisive close above 58,000 would strengthen the bullish bias, while failure to sustain could invite weakness. Traders should stay constructive yet disciplined, monitoring 57,000 on the downside and 58,000 on the upside for the next directional move.
Support: 57500-56850
Resistance: 58000-58683
Bias- Sideways to bullish
For Detailed Report With Disclaimer Visit. https://choicebroking.in/disclaimer
SEBI Registration no.: INZ 000160131