Weekly Outlook : Nifty & BankNifty on 16th February 2026 by Choice Broking Ltd

NIFTY WEEKLY OUTLOOK
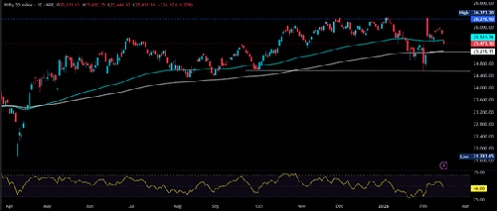
The Nifty index witnessed selling pressure during the week after opening on a strong note. Despite a positive start, the index failed to sustain at higher levels and gradually drifted lower, reflecting profit booking and lack of follow-through buying. Weak global cues and sectoral pressure, particularly from the IT space, kept the market under stress, resulting in a volatile yet range-bound structure.
The index recorded a weekly open of 25,888.70, touched a weekly high of 26,009.40, and slipped to a weekly low of 25,444.30. Nifty finally settled at a weekly close of 25,471.10, forming a bearish weekly candle and closing near the lower end of the range, indicating sustained selling interest at higher levels.
A key drag during the week was the IT sector, where consistent selling pressure was visible. Heavyweight IT stocks witnessed profit booking amid global tech weakness and cautious commentary, which restricted upside momentum in the broader index. The underperformance of IT played a significant role in capping gains near the 26,000 resistance zone.
On the weekly chart, Nifty formed a bearish candlestick with a noticeable upper shadow, highlighting rejection near the 26,000 supply zone. This confirms strong resistance at higher levels and reinforces the ongoing consolidation phase.
Immediate resistance is placed at 25,700. On the downside, strong support is seen at 25,300. A decisive break below 25,300 could accelerate downside momentum, while a sustained move above 25,700 may revive bullish sentiment. Given the current setup, traders should maintain a range-bound strategy with strict stop-loss discipline.
Support Levels:- 25300-25000
Resistance Levels :- 25700-26000
Overall Bias :- Sideways
Banknifty Weekly Outook
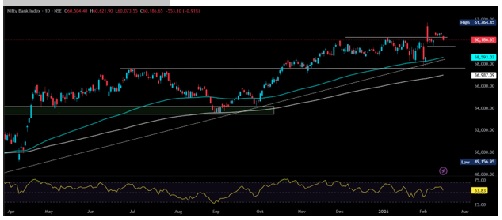
Bank Nifty experienced a range-bound yet volatile week amid macro triggers including Union Budget developments, US–India trade cues, and the RBI’s MPC outcome. The index opened the week at 60,805.20, recorded a weekly high of 60,876.20, slipped to a low of 60,073.55, and eventually closed at 60,186.65. The narrow trading range indicates consolidation near higher levels after the previous strong rally, reflecting balanced participation between buyers and sellers
Technically, the index continues to hover around the key psychological zone of 60,000, suggesting that this level is acting as an important equilibrium point. The inability to sustain above 60,800 highlights overhead supply, while the repeated defense of the 60,000 mark indicates underlying demand support.
On the downside, 59,800 remains a strong support zone for the coming sessions. A sustained breakdown below 59,800 may accelerate corrective pressure toward 59,000. On the upside, immediate resistance is placed at 60,500,. A decisive breakout above 60,500 could revive bullish momentum and shift the structure more firmly in favor of buyers.
Overall, the index is consolidating within a broader positive structure, and the next directional move is likely to emerge from either a breakout above 60,500 or a breakdown below 59,800.
Support: 59,800 – 59,000
Resistance: 60,500 – 61,400
Overall Bias: Sideways
For Detailed Report With Disclaimer Visit. https://choicebroking.in/disclaimer
SEBI Registration no.: INZ 000160131