

Nifty & Bank Nifty Weekly Outlook by Choice Broking Ltd

Nifty
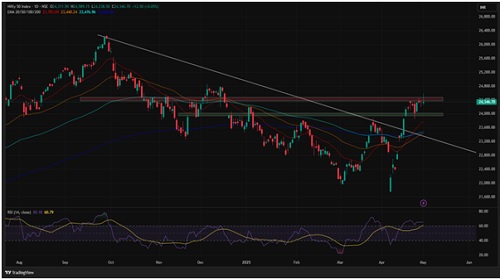
The Indian equity markets wrapped up the week on a flat-to-positive note, with the Nifty 50 managing to end slightly higher. However, despite intraday optimism and initial momentum, the index witnessed significant profit booking at higher levels, particularly as it approached the crucial 24,500 mark. This resistance triggered a sharp reversal from intraday highs, leading to the formation of a spinning top candlestick pattern on the daily chart — a signal of indecision and potential reversal, especially near key resistance zones.
From a technical perspective, the Nifty is currently trading in a narrow consolidation band between 24,500 and 24,000 levels. The index’s inability to sustain above 24,500 suggests selling pressure emerging from supply zones. A decisive close above 24,500 could open up further upside towards 24,800 and eventually the psychological 25,000 mark. However, until such a breakout occurs, the market is expected to trade with a sideways bias. On the downside, the immediate support lies near the 24,100–24,000 zone, where buying interest is expected to emerge, especially if broader sentiment remains stable.
Momentum indicators like RSI are showing signs of bearish divergence, which hints at weakening strength despite the index making higher highs. This divergence warrants caution among short-term traders, especially in a market where broader participation appears to be thinning, as seen in the underperformance of the midcap and smallcap segments. The BSE Midcap index declined by 0.4% for the week, while the Smallcap index remained flat — suggesting selective participation and profit-taking in high-beta pockets.
On the sectoral front, strength was seen in media, energy, IT, and oil & gas stocks, while power, metal, telecom, pharma, and consumer durables faced selling pressure. The market breadth was mixed, and sectoral rotation was evident, reinforcing the theme of consolidation and lack of clear leadership. However, sustained foreign institutional inflows remain a positive backdrop. FIIs have been consistent net buyers, infusing ?37,400 crore into Indian equities over the last 11 sessions, signaling underlying confidence in the Indian growth story.
Bank Nifty
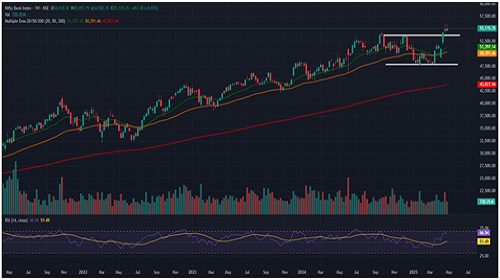
The Bank Nifty index closed at 55,115.35, registering a 0.83% gain from the previous week's close. The weekly chart indicates rejection at higher levels; however, the index has managed to hold above the crucial 55,000 mark. Additionally, the selling pressure at higher levels suggests a potential pause in the ongoing uptrend, pointing to a sideways or consolidation phase in the near term.
This week, the Bank Nifty index formed a small-bodied bullish candle with a long upper wick, supported by consistent trading volumes. This indicates rejection at higher levels and a possible pause in the current uptrend. The candlestick pattern reflects indecision among market participants and suggests a likely consolidation phase in the near term. A "buy on dips" strategy is recommended as long as the index holds above 53,500, with upside targets placed at 55,500 and 56,000.
On the weekly timeframe, Bank Nifty is trading above all its key moving averages, including the short-term 20-day, medium-term 50-day, and long-term 200-day Exponential Moving Averages (EMA). This indicates a strong bullish trend, suggesting that buyers remain in control and the index is maintaining upward momentum, with downside support near the 54,500–54,000 range. The Relative Strength Index (RSI) stands at 66.94, indicating mild bullish strength. However, the sideways movement suggests a phase of consolidation, potentially leading to a time-wise or price-wise correction as the index awaits fresh cues for the next directional move.
The Bank Nifty index is likely to face significant resistance in the 55,500–56,000 range. If the index continues to move higher, ICICI Bank from the private banking sector is expected to support the uptrend. Similarly, in the public sector banking space, SBI is anticipated to show strength.
For the ongoing expiry, put options have the highest concentration near 55,000 and 54,000, marking these as key support levels. Conversely, call options at 55,500 and 56,000 hold significant open interest, indicating potential resistance and suggesting a trading range of 55,000–56,000 for the upcoming sessions. Traders should remain cautious, consider buying on dips, and maintain strict stop-loss levels to manage risks effectively amid ongoing market volatility and potential price fluctuations.
For Detailed Report With Disclaimer Visit. https://choicebroking.in/disclaimer
SEBI Registration no.: INZ 000160131


.jpg)