Nifty & Bank Nifty Weekly Outlook 11-07-2026 by Choice Broking Ltd

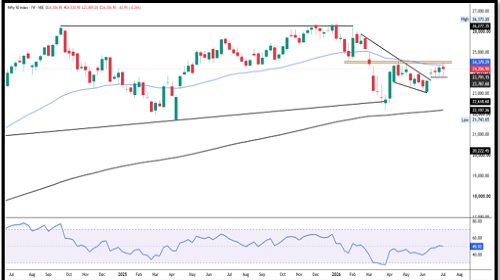
NIFTY WEEKLY OUTLOOK
The Nifty index started the week on a positive note, opening at 24,306.85 and extended its gains in the initial sessions to register the week's high of 24,530.90. However, the index witnessed strong rejection from higher levels, coinciding with the 200-Day EMA resistance zone on the daily chart, which triggered broad-based profit booking. The selling pressure intensified during the mid-week sessions, erasing the early gains and dragging the index to the week's low of 23,805.20. Buying interest emerged around this crucial support zone, helping the index recover a major part of the decline. Nifty eventually settled at 24,206.90, down 63.95 points (-0.26%) for the week, reflecting continued consolidation after the recent recovery.
The weekly price action indicates a volatile but range-bound market, with buyers consistently defending the 23,800 support zone while sellers remain active near the 24,500 resistance area. This suggests that the index is consolidating within a broader trading range, awaiting a decisive breakout for the next directional move.
From a technical perspective, Nifty has formed a Doji-like candlestick pattern on the weekly chart, indicating indecision as the index continues to trade within a well-defined sideways range. The weekly RSI is placed near 55.80, reflecting positive momentum while remaining comfortably above the neutral 50 mark, suggesting that the broader undertone continues to favor buyers. Meanwhile, the MACD remains in positive territory with the MACD line trading above the signal line, although the narrowing histogram indicates that bullish momentum has moderated and a fresh trigger will be required for the next up move.
On the derivatives front, the highest Open Interest (OI) on the Call side is concentrated at 24,500 CE, followed by 24,300 CE, indicating a strong resistance zone. On the Put side, the highest OI concentration is seen at 24,200 PE, followed by 24,000 PE, highlighting a firm support base and suggesting that market participants continue to adopt a buy-on-dips approach within the prevailing range.
On the upside, immediate resistance levels are placed at 24,500 and 24,600. A sustained move above this zone could trigger fresh buying momentum and pave the way for further upside. On the downside, support is placed at 23,800 and 23,700. A decisive breakdown below these levels may weaken the near-term structure and invite renewed selling pressure. Considering the current technical setup, traders are advised to maintain a stock-specific approach while following strict risk management until a decisive breakout from the ongoing consolidation range emerges.
Support Levels :- 23,800 - 23,700
Resistance Levels :- 24,500 - 24,600
Overall Bias :- Sideways to Bullish
BANKNIFTY WEEKLY OUTLOOK
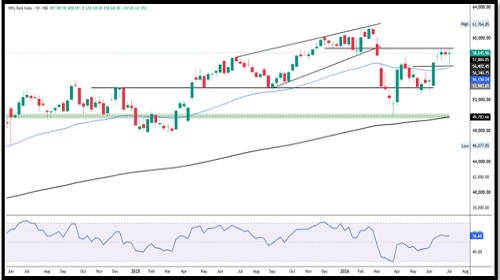
The Bank Nifty index started the week on a flat note, opening at 57,983.90 and witnessed steady buying interest during the initial sessions. The positive momentum helped the index climb to a weekly high of 58,581.10 on Tuesday. However, the rally failed to sustain at higher levels as profit booking emerged, dragging the index lower during the mid-week sessions. The decline extended towards the weekly low of 56,549.40 before fresh buying interest resurfaced from lower levels.
In the latter half of the week, Bank Nifty staged a strong rebound after taking support near the previous swing-high breakout zone, which also coincided with the 20-week and 50-week EMA support area. The recovery was primarily led by strength in PSU banking stocks, while heavyweight HDFC Bank, which gained around 3% during the week, provided significant support to the index. Bank Nifty eventually settled at 58,045.90, registering a marginal weekly gain of 107.40 points (+0.19%).
Technically, Bank Nifty formed a Doji-like candlestick on the weekly chart, reflecting indecision after the recent upmove. The index continued to trade within the last 3–4 weeks' consolidation range, but the successful rebound from the 20-week and 50-week EMA support zone, aligned with the previous swing-high breakout level, suggests that buyers remain active on declines and the broader bullish structure remains intact. Price action indicates demand emerging at lower levels, while higher levels continue to witness profit booking, resulting in a healthy consolidation within the prevailing uptrend. As long as the index sustains above the breakout support zone, the medium-term trend is likely to remain positive. The Weekly RSI stands at 56.88, remaining comfortably above the neutral 50 mark, indicating sustained positive momentum despite the ongoing consolidation.
Support: 57,400–57,000
Resistance: 58,700–59,000
Overall Bias: Sideways to Bullish
For Detailed Report With Disclaimer Visit. https://choicebroking.in/disclaimer
SEBI Registration no.: INZ 000160131