Nifty Buys Intraday Dips, Ends Strong - ICICI Direct

Nifty : 24317
Technical Outlook
Day that was ..
The equity benchmark index finished the monthly expiry session on a positive note as Nifty settled at 24,317, up 66 points. Broader markets underperformed with negative market breadth, as Nifty Midcap and Smallcap lost 0.3% and 0.5% respectively. Sector wise Auto, IT, and Oil & Gas outperformed while Realty and BFSI lagged behind.
Technical Outlook :
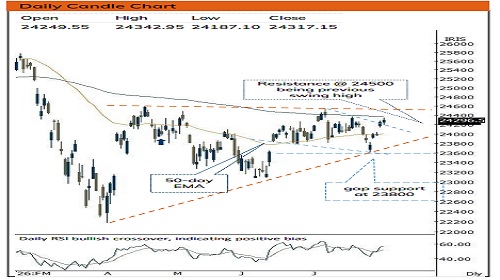
• Nifty opened on a flat note with intraday dips were bought into. The daily price action formed a bull candle with higher high-low structure indicating extension of ongoing up move.
• Nifty extended its recovery over fifth session and approached towards its long-term 200-day EMA which has been acted as a stiff hurdle since Feb 2026. Thereby, a clean decisive break above 200-day EMA would be first sign of structural trend improvement.
• The US Dollar index has breached below past five weeks low after retreating from the highs of $101.50 and currently trading below $100 mark. The cool off in Dollar index bodes well for emerging markets.
• Structurally, Nifty has rallied ~11% in the Month of April and seen then it has been consolidating in 1500 points. This entire price action has taken a shape of an ascending triangle, indicating buying demand at elevated support base that bodes well for eventual breakout in the coming weeks
• On a broader market perspective, Both Mid and Small-cap index staged a strong rebound after retesting its multi-year trendline breakout area. The current up move is backed by the improvement in the market breadth as currently 57% stocks are trading above their 50 days EMA (within the Nifty 500 universe) compared to past three weeks reading of 48% that bodes well for durability of up move.
• In the Month of July FII’s have sold ~9500 cr. which is drastically low compared to past six months average of 57000 cr. Considering growing anxiety over the return on massive AI spending and fear of competition from China focus has started to shift back to Indian which is visible in beaten down IT index
• The formation of higher high-low makes us confident to revise support base upward at 23800 being 80% retracement of current up move (23606- 24283) coinciding with upward sloping support trend line placed at 23760.
Key Monitorable :
a) The AI/Semiconductor induced rally in North Asian markets (Kospi, Nikkei) is now showing sign of exhaustion, resulting into extended profit booking. Conversely, this rotation could benefit growth-oriented economies like India wherein FII’s outflows have started to witness deterioration.
b) Brent crude has been miniating the rhythm of arresting pullback after a sharp decline in amid geopolitical conflict around 40%. Falling crude would fuel the momentum in the equities
c) Empirically, after such a pattern crude undergoes consolidation and eventually revisits the panic low in subsequent quarters. Therefore, we believe falling crude oil would be the primary catalyst to reignite momentum in equities
d) USD-INR pair treated after forming double top amid negative divergence and snapped four weeks winning streak which would act as positive catalyst for Indian equities
Intraday Rational :
• Trend – Formation of higher high-low structure in daily time frame, indicating positive bias.
• Levels – Buy around 61.8% retracement of Thursday range
Nifty Bank : 57148
Technical Outlook
Day that was :
Bank Nifty ended Sensex expiry session on a flat note down 0.1% at 57148 on back of mixed global cues.
Technical Outlook :
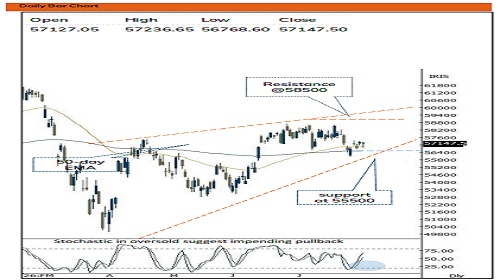
• Index opened on negative note and thereafter found supportive effort from 38.2% retracement levels of current up move around 56800 and rebounded higher to close on flat note. Consequently, the daily price action resulted into high wave candle with shadows on either side indicating elevated volatility.
• Going ahead we expect, index to resolve higher while sustaining above 200 days EMA placed at 56500 and gradually head towards upper band of consolidation placed at 58500 in coming month. The key support zone of 56500- 56000 is a placement of the 38.2% retracement of entire rally (49954-58706) and gap-area is placed around 55,500 levels.
• Another observation is that over last 4 weeks Index has retraced by 38.2% of earlier 3 weeks rally, indicating slower pace of retracement which would help to set stage for next leg of rally.
• The PSU Bank Index has formed small hammer like candle at 200-day EMA indicating buying demand from key moving average. Going ahead follow through strength above Mondays(8423) high would set the stage towards 8700 levels
Intraday Rational :
• Trend - Supportive efforts emerged from the lower band of the contracting triangle
• Levels – Buy around 61.8% retracement of Thursday rang
Please refer disclaimer at https://secure.icicidirect.com/Content/StaticData/Disclaimer.html
SEBI Registration number INZ000183631