Nifty and Bank Nifty Weekly Outlook by Choice Broking Ltd

Nifty
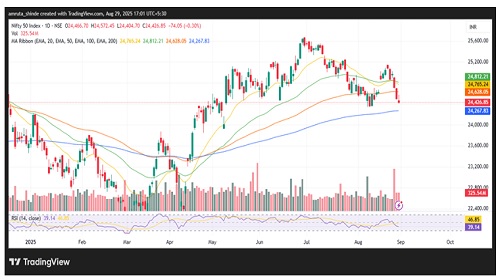
Indian equity benchmarks ended the week on a weak note, pressured by persistent selling for the third consecutive session. The Nifty 50 closed at 24,426.85, down 74 points (-0.35%), while the Sensex slipped 270.9 points (-0.34%) to settle at 79,809.65. On the daily chart, Nifty formed an inverted hammer, a bearish candlestick pattern indicating sustained selling pressure at higher levels. Despite briefly reclaiming the 24,500 mark during the week, the overall sentiment remained cautious as investors preferred profit booking amid heightened volatility.
From a technical perspective, Nifty is currently hovering around its recent swing-low support range of 24,337–24,267 (200-day EMA). A decisive breakdown below this zone could extend the decline toward 24,165 (gap support) and subsequently to 24,079 (50-week EMA) and 24,000, which together form a broader support area. On the upside, resistance is placed in the 24,700–24,850band. A strong close above this range may shift market momentum in favor of the bulls and trigger a fresh rally.
Momentum indicators continue to suggest weakness. The RSI has slipped to 39.14 and is trending lower, signaling declining strength. On the derivatives front, heavy Call OI at 24,600–24,500 is likely to cap the upside, while Put OI at 24,400 may provide near-term support.
Outlook: The broader setup remains sideways to cautiously bearish, with the index stuck between key support and resistance zones. A breakout above 24,700 could open the way toward 24,850+, while a breakdown below 24,267 may invite fresh selling pressure, dragging Nifty lower to 24,165–24,000. Until a decisive move on either side, volatility is expected to persist. Investors should maintain a cautious approach and closely monitor global as well as domestic triggers.
Support Levels:-24267-24000
Resistance Levels :-24700-24850
Overall Bias :- Sideways To bearish
Bank Nifty
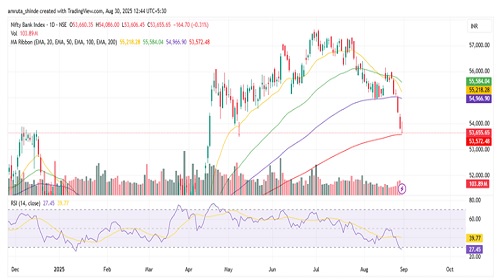
Bank Nifty ended lower on Friday, closing near 53,655 after facing resistance and rejection around the 54,000 level, reflecting strong selling pressure. On the daily timeframe, the index has formed a bearish Gravestone Doji, marking its seventh consecutive red close and signaling sustained weakness. Consequently, Bank Nifty has formed a strong bearish candle on the weekly chart, wiping out nearly 1,493 points in a single week.
If this selling pressure persists and the index breaks below 53,570 (200-day EMA), it could trigger a deeper corrective move toward 53,480 and 53,000. However, if the 200-day EMA holds as support and Bank Nifty manages to rebound, immediate resistance is placed around 54,000. A sustained breakout above this zone may attract fresh buying, with potential upside targets at 54,450 and 54,900.
Technical indicators further support the bearish bias. The RSI stands at 27.45, trending downward and entering the oversold territory, indicating weakness in momentum. Additionally, Bank Nifty has closed below both the 20-day EMA and the 50-day EMA on the daily chart, underscoring the prevailing bearish sentiment.
Given the current setup, traders are advised to remain cautious and follow strict risk management. A decisive close above 54,450 resistance or a breakdown below 53,570 support will be crucial in determining the next significant directional move in Bank Nifty.
Support: 53570-53000
Resistance: 54000-54900
Bias- Sideways to Bearish
For Detailed Report With Disclaimer Visit. https://choicebroking.in/disclaimer
SEBI Registration no.: INZ 000160131


.jpg)
More News

Quote on Weekly market outlook 01st August 2025 by Vinod Nair, Head of Research at Geojit In...