Nifty and Bank Nifty Weekly Outlook by Aakash Shah Research Analyst Choice Broking

NIFTY WEEKLY OUTLOOK
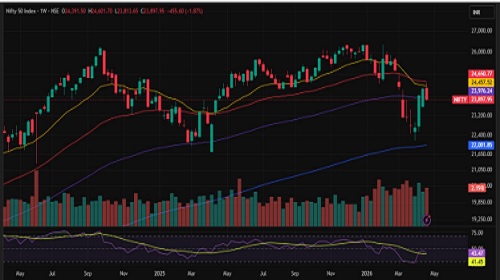
The Nifty index opened the weekend session on a flat note, suggesting a lack of strong directional bias at the start. It subsequently moved higher to mark an weekly high of 24,601.70; however, the index failed to sustain at elevated levels and witnessed a sharp correction from the top. This decline led to a breakdown below the 20-day exponential moving average (DEMA), with the index slipping to a weekly low of 23,813.65. As a result, it formed a bearish weekly candle and eventually closed at 23,897.95, registering a loss of 455 points (-1.87%), indicating weakening momentum and increased selling pressure.
Additionally, the index closed below its 100-week exponential moving average (EMA), which further reflects a deterioration in the broader trend and signals a cautious outlook in the medium term. On the weekly timeframe, the technical indicator stands at 43.47, suggesting subdued strength and a possible continuation of the bearish undertone
On the upside, immediate resistance is placed at 24,000, followed by 24,150 and 24,350 levels. On the downside, support is seen at 23,800 and then at 23,700. A decisive break down below 23,500 could trigger further downside pressure. Given the current volatility, traders are advised to remain cautious and adhere to strict risk management practices.
Support Levels :- 23,800-23,500
Resistance Levels :- 24,000 – 24,350
Overall Bias :- Sideway
BANKNIFTY WEEKLY OUTLOOK
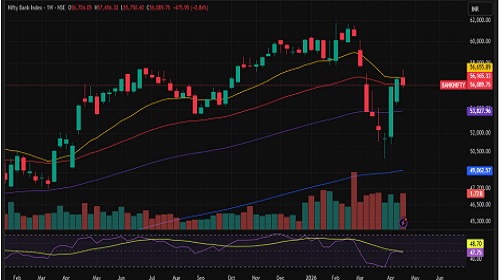
The Bank Nifty index opened the session on a flat note at 56,704.05, suggesting initial indecision among market participants. The index moved higher to register a weekly high of 57,456.30 but failed to sustain at elevated levels, witnessing a subsequent correction. It then declined to form a weekly low at 55,750.40 before closing at 56,089.75, marking a loss of 475.95 points (-0.84%). This price action reflects profit booking at higher levels and a lack of sustained buying interest. It is also notable that the index briefly broke out above its 20-week and 50-week exponential moving averages (EMA), but as the weekly session concluded, it slipped back below these key levels, indicating a false breakout and continued resistance in the higher zone.
In the near term, immediate downside support is placed in the 55,600–55,000 zone in case selling pressure reemerges. On the upside, 56,700 acts as immediate resistance, while 57,000 stands as the next key supply zone.
From a momentum standpoint, the weekly RSI at 47.75 indicates neutral to slightly bearish momentum, suggesting a lack of strong directional strength. However, failure to reclaim higher levels may keep the index under short-term corrective pressure. Traders are advised to remain cautious and follow disciplined risk management while closely tracking key levels for the next directional move.
Support: 55,600–55,000
Resistance : 56,700 -57,000
Overall Bias :- Sideways
For Detailed Report With Disclaimer Visit. https://choicebroking.in/disclaimer
SEBI Registration no.: INZ 000160131