Nifty and Bank Nifty Weekly Outlook 17th May 2026 by Aakash Shah Research Analyst Choice Broking

NIFTY WEEKLY OUTLOOK
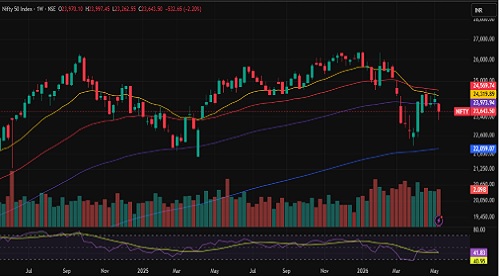
The Nifty index started the week with a modest gap-down of around 206 points, opening at 23,970.10. Post the opening, the index attempted a recovery and touched the day’s high of 23,997.45. However, it failed to sustain at higher levels, following which the market witnessed broad-based selling pressure and slipped sharply to form a weekly low of 23,262.55, indicating weak market sentiment and continued profit booking at higher zones. By the end of the week, the index settled at 23,643.50, registering a loss of 532.65 points or 2.20%.
From a technical perspective, the RSI on the weekly timeframe stands at 41.83, reflecting weakening momentum and a cautious undertone in the broader trend. Overall, the price action suggests that the index remains under pressure, with volatility and bearish sentiment dominating the market structure.
On the upside, immediate resistance levels are placed at 24,000 and 24,250. On the downside, support is seen at 23,250 and 23,000. A breakdown below the 23,000 mark could trigger further selling pressure in the near term. Considering the current market setup, traders are advised to remain disciplined and follow strict stop-loss strategies amid ongoing volatility.
Support Levels :- 23,250 -23,000
Resistance Levels :- 24,000-24,250
Overall Bias :- Sideways
BANKNIFTY WEEKLY OUTLOOK .
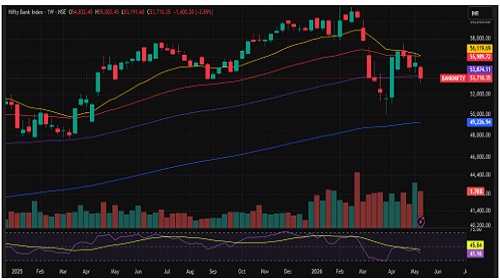
The Bank Nifty index opened the week on a negative note at 54,832.45, reflecting weak market sentiment amid broad-based selling pressure. The index initially moved higher and marked a weekly high of 55,002.45 before witnessing a sharp correction, eventually slipping to a weekly low of 53,191.60, indicating sustained profit booking and weakness at higher levels. However, the index attempted a recovery from lower zones and finally settled at 53,710.35, losing 1,600.20 points or 2.89% for the week, suggesting continued bearish undertones in the broader trend. This price action reflects heightened volatility and cautious market sentiment.
It is also noteworthy that, on the daily chart, the index briefly slipped below its 20-DEMA, 50-day EMA, and 200-DEMA, signalling weakening short-term momentum and a deterioration in the prevailing trend structure. In the near term, immediate downside support is placed in the 53,200–53,000 zone in case selling pressure re-emerges. On the upside, 54,400 acts as immediate resistance, while 54,850 stands as the next key supply zone.
From a momentum standpoint, the weekly RSI at 41.16 indicates weakening strength and a cautious undertone in the index. However, failure to reclaim higher levels may keep the index under short-term corrective pressure. Traders are advised to remain cautious and follow disciplined risk management while closely tracking key levels for the next directional move.
Support: 53,200- 53,000
Resistance : 54,400 -54,850
Overall Bias :- Sideways
For Detailed Report With Disclaimer Visit. https://choicebroking.in/disclaimer
SEBI Registration no.: INZ 000160131