Nifty and Bank Nifty Weekly Outlook 05th July 2026 by Aakash Shah Technical Research Analyst Choice Broking

NIFTY WEEKLY OUTLOOK
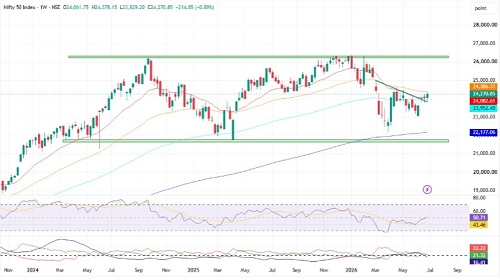
The Nifty 50 extended its winning streak for the third consecutive session and closed the week at
24,271, gaining 215 points (+0.89%) on a weekly basis. The index witnessed a decisive breakout
above the crucial 24,200 resistance zone, ending a prolonged consolidation phase and improving
the overall market structure.
From a technical standpoint, Nifty continues to trade above its 100-day EMA (24,131) and has
successfully closed above the falling resistance trendline near 24,200, both of which are expected
to act as immediate support levels in the coming week. Although the index formed a bearish
candle on the daily chart after profit booking at higher levels, it managed to sustain the bullish
gap, indicating that the broader trend remains positive.
Momentum indicators continue to strengthen. The RSI has moved above 60 and stands at 60.95,
signaling improving bullish momentum. The DI+ has crossed above DI- on the ADX indicator,
suggesting that buyers are gradually gaining control. Additionally, the MACD histogram
continues to strengthen, reflecting increasing upside momentum.
On the weekly timeframe, Nifty formed a strong bullish candle after witnessing Doji-like
formations over the previous two weeks. The presence of long lower shadows in the last three
weekly candles indicates strong buying interest at lower levels and suggests that the
consolidation phase may be nearing completion.
For the coming week, 24,050–24,150 is expected to act as the immediate support zone, while
24,421 (200-day EMA) remains the first major resistance. A sustained move above 24,421 could
open the doors for a rally towards 24,600, which coincides with the April swing high and
remains a crucial hurdle for the bulls.
Options data also supports a positive outlook, with the highest Put open interest concentrated at
24,000, indicating strong support, while the 24,300–24,500 zone is likely to act as the immediate
resistance area due to significant Call open interest.
A further positive for the market is the continued decline in India VIX, which fell 3.99% to
11.79, marking its lowest closing level since February. Lower volatility generally supports
higher equity prices and reflects growing confidence among market participants.
Support Levels: - 24,050 – 24,150
Resistance Levels: - 24,400 - 24,600
Overall Bias: - Sideways to Bullish
BANKNIFTY WEEKLY OUTLOOK
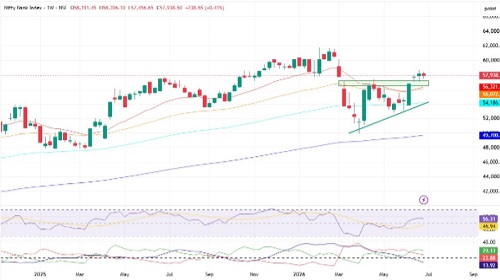
Bank Nifty underperformed the benchmark Nifty during the week and closed at 57,938.50,
declining 93.15 points on Friday and ending the week with a loss of approximately 0.41%.
Despite the recent weakness, the banking index continues to trade comfortably above all major
moving averages, indicating that the broader trend remains constructive.
On the daily chart, Bank Nifty formed a sizeable bearish candle, reflecting profit booking and
lack of follow-through buying at higher levels. Momentum indicators suggest that the index is
currently undergoing a consolidation phase. The index continues to maintain relative strength
versus the broader market, but its relative momentum is beginning to fade.
The RSI remains range-bound and continues to move sideways, reinforcing the view that Bank
Nifty is consolidating rather than entering a fresh downtrend. On the weekly timeframe, the
index formed a small bearish candle with a long lower shadow after high-wave and Doji
formations in the previous two weeks, highlighting indecisiveness among market participants.
From a technical perspective, the immediate support zone is placed at 57,400–57,500. This area
remains critical for maintaining the positive structure of the index. As long as Bank Nifty holds
above this support band, any correction is likely to attract buying interest.
On the upside, the immediate hurdle is placed at 58,400–58,500. A decisive and sustained
breakout above this resistance zone could trigger fresh momentum buying and lead to an advance
towards 58,900, followed by 59,300 in the short term.
Support: 57,400–57,500
Resistance: 58,400–58,500
Overall Bias: Sideways to Bullish
For Detailed Report With Disclaimer Visit. https://choicebroking.in/disclaimer
SEBI Registration no.: INZ 000160131