MOST Quantitative Outlook Monthly 02nd December 2025 by Motilal Oswal Wealth Management

Bank Nifty
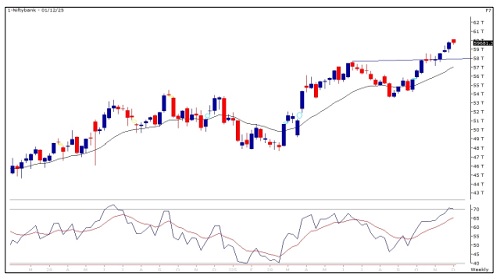
Bank Nifty exhibited an escalation above the previous ceiling and touch a fresh all time high of 59897 zones. The PSU names continue to outshine and capitalized on any minor dips. On the monthly scale, Bank Nifty formed a bullish candle and any intermittent profit booking was covered by buying attempts. Price action suggests that a sustained hold above 59000 zones could open further upside move towards 61000 and then 61500 zones, while on the flip side, supports are placed at 58500 and then 57750 zones
Nifty Pharma Index
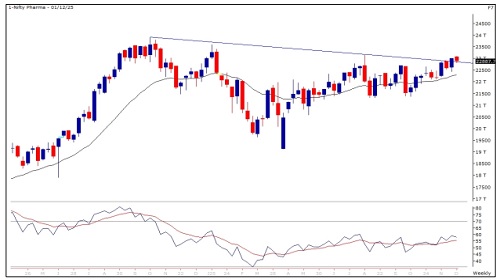
Nifty Pharma Index has given a symmetrical triangle pattern breakout on the weekly chart and is holding above the same. On daily scale it has retested its breakout zones and inched higher. It is perfectly respecting its 20 DEMA with slight dips being bought into. Thus, looking at the overall chart setup we are expecting the sector to head towards previous life time highs of 23907 then 24500 zones while on the downside support is at 22400 then 21900 levels.
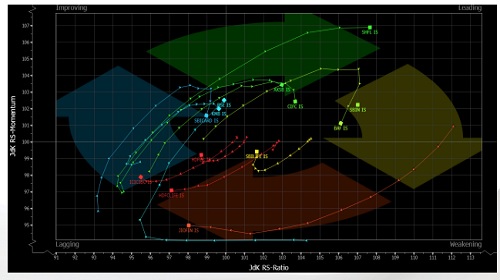
Relative Rotation Graphs(RRG):
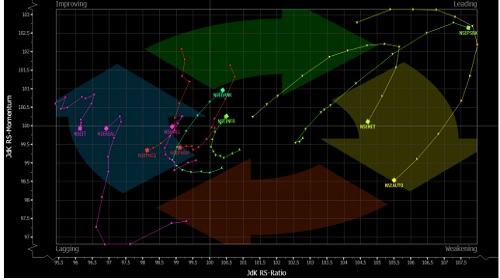
Relative rotation graphs chart shows the relative strength and momentum for group of Stocks/ Indices. It allows us to compare a security against the benchmark to see if it is outperforming or underperforming the benchmark. It is derived on the relative strength in which value of a sector is divided by the value of index mainly a benchmark which allows us to compare the performance of the sector. Relative Strength ratio is normalized to oscillate around 100 (plotted on X axis) i.e Jdk RS- Ratio along with this it provides the speed and direction of the Relative strength ratio (plotted on Y axis) i.e Jdk RS- momentum. The scatter plot is divided into four quadrants i.e Leading, Weakening, Lagging and Improving quadrant.
The analysis of sectorial RRG shows that Nifty Bank, Infra, PSU Banks and Metal are in the leading quadrant which indicates strength going ahead. Nifty Auto is in the weakening quadrant which suggests momentum is likely to decline. Nifty Pharma and FMCG are inside the lagging quadrant which shows strength and momentum both are missing. Nifty IT, Energy and Realty are under the improving quadrant which suggests strength is still low but momentum will start improving.
Nifty Auto Index
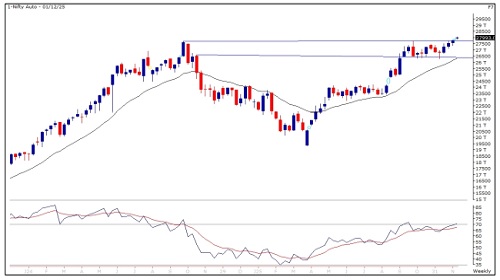
Nifty Auto Index is in an overall uptrend and is continuously making higher top-higher bottom formation on the monthly scale. It has given a consolidation breakout of the last ten weeks which has bullish implications and is trading above all short term and long term moving averages. Momentum indicator RSI is positively placed and thus, looking at the overall chart setup we are expecting the sector to head towards 28800 and 29500 zones while on the downside support is at 27400 and 27000 levels.
RRG For Nifty Auto
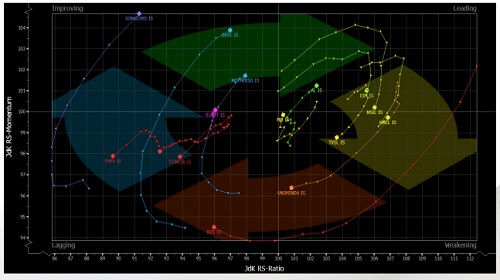
The analysis of RRG for Auto Index shows that Ashok Leyland, Eicher Motors and Maruti are in the leading quadrant which indicates strength going ahead. Unominda and TVS Motor are under the weakening quadrant which suggests momentum is likely to decline. Bosch, Bajaj Auto, Tata motor passenger vehicle and TI India are in the lagging quadrant which shows strength and momentum both are missing. Motherson sumi, Bharat forge and Sonacom are under the improving quadrant which suggests strength is still low but momentum will start improving.
Nifty Financial Services Index
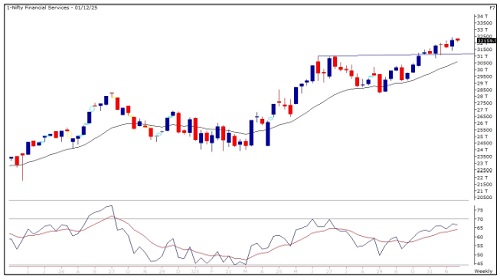
Nifty Financials Index has given a trend line breakout on the weekly chart; retested the same and scaled upwards. On daily scale it has given a Cup & Handle pattern breakout which is a bullish continuation pattern. ADX line is rising which confirms the strength of the trend. Thus, looking at overall chart setup we are expecting the sector to head towards 28400 and 29000 zones while on the downside support is at 27000 and 26600 levels.
RRG For Nifty Financial Services
The analysis of RRG for Financial Index shows that Shriram Finance, State bank of India, Bajaj finance, Chola Invt and Axis Bank are in the leading quadrant which indicates strength going ahead. ICICI Bank, HDFC Life, Jio Fin and HDFC Bank are in the lagging quadrant which shows strength and momentum both are missing. SBI Card, BSE and Kotak Bank are under the improving quadrant which suggests strength is still low but momentum will start improving.
India VIX
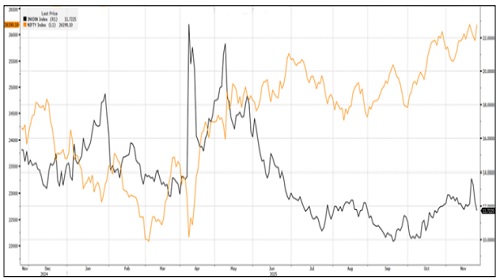
India VIX increased by 2.42% from 11.95 to 12.24 levels in the November series. It briefly edged up towards 14 marks, triggering short-lived swings and some intraday volatility in the last two weeks of the series. Still, the broader volatility backdrop remains muted, which continues to favour the bulls and points to a relatively steady market tone going forward.
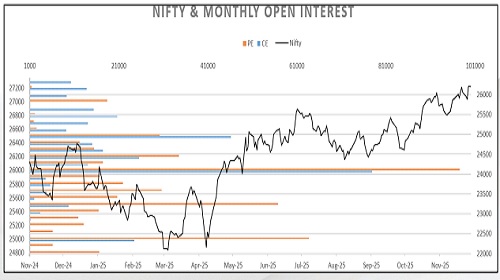
Nifty OI V/S Price
Rollover of Nifty stood at 68.77%, which noticeably below its quarterly average of 75.7%. In the November series, open interest fell by 4.1% while the index slightly fell by 0.2% on an expiry-to-expiry basis, suggesting a large portion of the early month short positions were unwounded in the November series. Rollover in Bank Nifty stood at 70.4%, which is lower than its quarterly average of 76.2%. Short covering was seen as open interest decreased by 25.2% and price was up by 1% on an expiry-to-expiry basis. Nifty begins the December series with open interest of 14.55 mn shares as compared to 15.17 mn shares at the start of the November series. Open interest activity in Nifty has decreased with flattish price movement suggesting early shorts were covered and could trigger the index to soar near its all-time highs.
The November F&O series kicked off with a relatively light positional setup. In the early sessions, the index drifted down towards 25300 zones, reflecting some initial softness. However it quickly reversed those losses with a sharp V-shaped rebound from lower levels, eventually scaling a new 52-week high at 26246. Importantly, this swift recovery appeared to be driven more by short covering than by the addition of meaningful fresh longs. On an expiry-to-expiry basis, Nifty formed a strong bullish candle with an extended lower shadow, highlighting consistent buying interest at declines and a firm comeback by the bulls. The recovery was also backed by broad sectoral participation and an overall improvement in the market sentiment. Put Call Ratio based on Open Interest of Nifty started the series near 1.14 and oscillated in between 0.75 to 1.44 levels to finally end the series at 0.95. On option front, Maximum Call OI is at 27000 then 26000 strike while Maximum Put OI is at 26000 then 25000 strike. Call writing is seen at 27000 then 26700 strike while Put writing is seen at 25600 then 26000 strike. Option data suggests a broader trading range in between 25200 to 27200 zones while an immediate range between 25700 to 26700 levels
Option Strategies
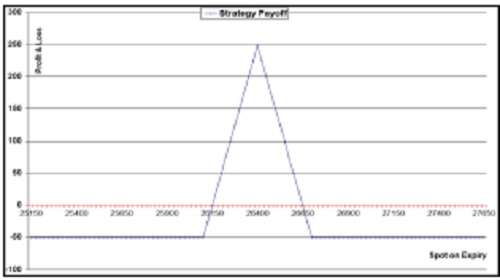
NIFTY
* Nifty posted a strong two-month rally and hit fresh lifetime highs in the last week of November.
* It has formed a bullish candle on the monthly chart and continues to hold gains in record territory, maintaining its higher-top higher-bottom structure.
* Maximum Put OI is inching up and is now placed at the 26000 strike, while Call OI remains concentrated near the 27000 zone.
* This setup suggests deploying a Bull Call Butterfly Spread to capitalize on the ongoing upside momentum along with a likely decline in volatility.
BUY 1 LOT OF 26100 CALL
SELL 1 LOT OF 26400 CALL
SELL 1 LOT OF 26400 CALL
BUY 1 LOT OF 26700 CALL
Margin Required : Rs.80,000
Net Premium Paid : 50 Points (Rs.3750)
Max Risk : 50 Points (Rs.3750)
Max Profit: 250 Points (Rs.18750)
Lot size : 75 Profit if it remains in between 26150 to 26650 zones
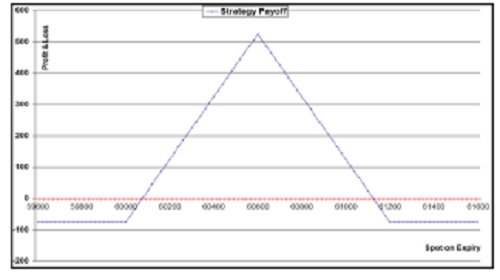
Bank Nifty
* Bank Nifty index is in strong uptrend and gave range breakout on monthly scale with strong bullish candle.
* Index is forming higher low structure on weekly scale as bigger trend is positive with overall buy on dips stance.
* Maximum Put OI is intact at 59000 then 59500 levels while Call OI is at 60000 then 61000 strike.
* Thus suggesting Bull Call Butterfly Spread to play the upside momentum with decline in volatility.
BUY 1 LOT OF 60000 CALL,
SELL 1 LOT OF 60600 CALL ,
SELL 1 LOT OF 60600 CALL,
BUY 1 LOT OF 61200 CALL
Margin Required : Rs.85,000
Net Premium Paid : 80 Points (Rs.2800)
Max Risk : 80 Points (Rs.2800)
Max Profit: 520 Points (Rs.18200)
Lot size : 35 Profit if it remains in between 60080 to 61120 zones
For More Research Reports : Click Here
For More Motilal Oswal Securities Ltd Disclaimer
http://www.motilaloswal.com/MOSLdisclaimer/disclaimer.html
SEBI Registration number is INH000000412