Monthly Technical Outlook & Picks - Axis Securities

Monthly Chart Analysis
After five consecutive months of decline, the benchmark indices staged a relief rally, posting a 6.3% gain and signaling a potential short-term pause. The monthly price action formed a bullish candle near the psychological support 22,000. Since Jan’25, the index has been consolidating within a broad 23,800–22,000 range, reflecting heightened volatility around its primary support zone.
We adopt a cautiously optimistic stance, anticipating a range-bound to mildly positive trajectory between 24,200 and 22,500. The upward-sloping monthly trendline reinforces the 22,400–22,300 zone as a critical support area, offering a strategic window for accumulation.
Weekly Chart Analysis
The weekly trend appears mildly bullish, supported by a minor bounce back and positive divergence on the weekly strength indicator (RSI), indicating early signs of a potential bottoming formation. In this phase, traders must remain cautious and adopt a selective approach, focusing on stock and sector-specific opportunities.
A decisive breakout above the 23,800 mark could trigger fresh bullish momentum, paving the way for an upswing toward 24,000–24,500. Conversely, a breach below the crucial 22,200– 22,000 support zone may intensify selling pressure, opening the downside toward 21,800– 21,500–21,200 levels.
Expected Trade Range
Nifty: 24200-22600 | Sensex: 80200-74300
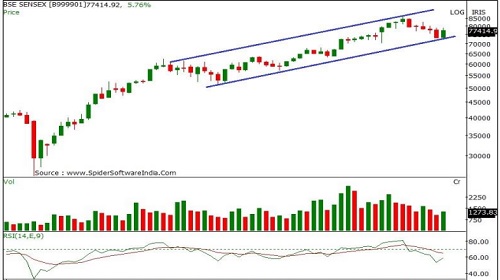
Trend - The benchmark index has experienced a pause in its recent downward trend over the last five months, registering a 5.8% gain. With the current month's price action, the benchmark index holds its two-year “up-sloping channel’s” support zone, indicating a positive bias. The index continues to move higher on a broader timeframe, forming a consistent series of higher tops and bottoms. This suggests that any upcoming minor corrections toward the identified support zone provide investors with an opportunity for accumulation.
Pattern - The monthly price action has formed a bullish candle near the channel’s lower end support zone, at the 73,400-73,100 levels. The index is sustaining above its 20- and 50-day SMAs, which signals early signs of short-term trend reversal.
Momentum - The monthly RSI is in adverse terrain, which signals a bearish bias.
Direction - The index is expected to trade with a mixed bias between the 77,800-72,500 levels.
Volatility - The weekly ATR has reached 2,085 points, which means the Sensex currently has a range of 2,085 points for a given week. However, in the daily timeframe, it has been highly volatile throughout the month, with several ups and downs, indicating that volatility may continue to expand in the coming days. INDIAVIX (12.72) has decreased by 8%, indicating reduced volatility.
Market breadth - The Sensex closed at 77,415 in the previous month, gaining 5.76%. Meanwhile, the BSE Midcap and BSE Smallcap indices gained 8% and 7%, respectively, indicating that the BSE Smallcap outperformed the Sensex and the BSE Midcap. Ninety-two stocks in the BSE 500 index are above the 200-day simple moving average (SMA), suggesting that the broader trend remains weak. Additionally, market breadth has improved compared to last month, when 67 stocks were above their 200-day simple moving average (SMA).
Our Take - The Sensex is undergoing a short-term downtrend marked by narrow consolidations within 78,800-72,000 levels, reflecting a sideways to positive bias. The benchmark index is facing stiff resistance from its 200-day SMA at 79,188, which remains a critical hurdle, indicating a bearish undertone. However, the outlook remains bullish on a broader timeframe, with potential for sector rotation within the ongoing bull market.
Investors are encouraged to adopt a buy-on-dips strategy, as short-term corrections offer attractive entry opportunities. The short to medium-term trend appears neutral to negative from current levels, with the possibility that the index will likely consolidate within the 78,800-72,000 levels. Any violation of the 72,600 support zone may cause selling pressure towards the 70,200-68,300 levels. Conversely, an immediate supply zone is observed in the 78,000- 79,200 range

Trend - The index has gained around 6% to close at 23,519. Despite this, the primary trend remains bullish, with the index maintaining a higher top and bottom pattern in the broader timeframe. Any minor corrections toward the support zone are considered accumulation opportunities, reinforcing a positive long-term outlook with the potential for continued upward movement.
Pattern - The monthly price action has formed a sizable bullish candle, indicating short covering at lower levels. The index is sustaining below its 100- and 200-day SMAs, which signals weakness in the near term.
Momentum - The monthly RSI has turned negative after exiting the overbought zone, signalling a loss of strength.
Direction - The index is expected to trade with a negative bias, fluctuating between the 23,400 and 21,300 levels
Volatility - The weekly ATR stands at 759 points, suggesting that the Nifty currently has a weekly range of 759 points. On the daily timeframe, volatility has been pronounced, with notable fluctuations throughout the month. This suggests potential volatility expansion in the coming days. INDIAVIX (12.72) has decreased by 8%, indicating reduced volatility.
Market Breadth - In the previous month, the Nifty gained approximately 6%, while the NSE Midcap and NSE Smallcap indices increased by 8% and 9%, respectively. This indicates that the NSE Smallcap outperformed the Nifty and the NSE Midcap. Notably, 94 stocks in the NSE 500 index are trading above their 200-day SMA, up from 69 last month, indicating an increase in market breadth and a short-term bearish bias.
Our Take - The Nifty is undergoing a short—to medium-term downtrend marked by lower tops and lower bottoms within 24,200-22,000 levels, reflecting a negative trend. The benchmark index sustained below its 100 and 200-day SMAs, indicating a bearish undertone. However, the outlook remains bullish on a broader timeframe, with potential for sector rotation within the ongoing bull market.
Investors are encouraged to adopt a buy-on-dips strategy, as short-term corrections offer attractive entry opportunities. The short—to medium-term trend appears neutral to negative from current levels, with the possibility that the index may likely correct towards the 21,500-21,300 levels. Any 21,300 support zone violation may cause selling pressure towards the 21,000-20,600 levels. Conversely, an immediate supply zone is observed in the 23,000- 23,800 range.

Trend - The benchmark index has witnessed a strong bounce back from its prior support zone of 54,800-54,400 levels, indicating buying support at lower levels. Currently, the index is consolidating within 61,500-54,400 levels, representing a short to medium-term sideways trend. The index remains in a long-term uptrend on a larger time frame, so buying and accumulation staggered around the mentioned support zone is advisable.
Pattern - The monthly price action has formed a sizable bullish candle, surpassing the past couple of months’ highs on a closing basis, indicating buying support at lower levels.
Momentum - On the monthly chart, the RSI(14) has turned bullish and is sustaining above its reference line, indicating rising strength.
Direction - On the short–term charts, the index is sustained above its 20, 50, 100, and 200-day SMAs, reaffirming a positive bias.
Volatility - The weekly ATR has reached 1,951, suggesting that the banking index currently has a range of 1,951 points in a given week. In the daily timeframe, the ATR fluctuated between 436 and 1,176 levels, indicating a loss of momentum
Volume - ICICIBANK, INDUSINDBANK, and RBLBANK have registered rising volumes compared to the previous month.
Our Take - If the BSE Bank index sustains above the 60,000 level in the upcoming weeks, it may extend its momentum toward 61,300-61,800-63,500 levels. Conversely, if it stays below the 57,200 levels, a correction toward 54,500, 53,300, and 51,700 levels could follow. We advise traders to view minor corrections near the support zone as opportunities for traders and investors to buy.

Trend - The benchmark index has observed short covering at lower levels, pulling the index higher to close in green. For the third consecutive month, the index has sustained below its four-year "up-sloping trendline" support zone on a closing basis, indicating a bearish trend.
Pattern - The index has formed a bullish candlestick; however, it has formed a lower high-low formation compared to previous months, indicating a negative bias. The index is sustaining below its 20, 50, 100 and 200-day SMAs, which reconfirms a bearish bias.
Momentum - The monthly strength indicator RSI is in bearish mode and sustaining below its reference line, signalling a loss of strength at higher levels.
Direction - The index is expected to continue its primary uptrend. Therefore, minor corrections towards the support zone remain a buying and accumulation opportunity for investors.
Volatility - The weekly ATR has reached 3,510, meaning the capital goods index currently has a range of 3,510 points for the week. In the daily timeframe, the ATR fluctuated between 1,542 and 1,000, with some ups and downs, indicating increased volatility in the near term.
Volume - Stocks like BHARATFORGE, CARBORUNDUM UNIVERSAL, GMRAIRPORT, and HAL have registered above-average volumes compared to the previous month.
Our Take - The benchmark index is in bearish mode and sustaining below its crucial averages of 20, 50, 100, and 200-day SMA, which reconfirms its bearish bias. The crucial support zone to watch is around the 54,500 levels. However, violating this zone may lead to profit booking towards 53,500-51,600 levels. As the primary trend remains bullish, these minor corrections can be utilised as accumulation opportunities for quality stocks.

Trend —The BSE Realty index has formed a small bullish candle near the 50% Fibonacci retracement level of the prior up move, representing a short-term pause in its recent downfall. In addition, the benchmark index is sustaining above its five-year “up-sloping channel,” which signals a primary uptrend.
Pattern —The monthly price action has formed a small bullish candlestick and sustained higher tops and bottoms on the monthly time frame, indicating a long-term bullish trend.
Momentum – The monthly RSI(14) remains in negative territory, quoting below its reference line, which signals a loss of strength on the larger timeframe.
Direction – The long-term uptrend is expected to remain bullish; hence, minor corrections toward the support zone should be viewed as opportunities for buying and accumulation.
Volatility —The weekly ATR stands at 457, indicating the index's current weekly range of 457 points. The ATR fluctuated between 156 and 217 in the daily timeframe, signalling reduced near-term volatility.
Volume – Stocks such as GODREJPROP and PRESTIGE have recorded higher volumes over the past month, reflecting increased market activity in these counters.
Our Take —The benchmark index is in corrective mode, whereas the primary trend remains bullish. Hence, investors may consider using corrections to accumulate quality stocks within the sector. On the upside, the index is expected to encounter resistance around the 6,900-7,200-7,450 levels in the coming weeks.

Trend - The benchmark index has extended its downfall and sustained its past four years' “up-sloping trendline” on a closing basis, indicating trend reversal.
Pattern - The monthly price action has formed a small bullish candle that resembles a “Doji,” indicating a short-term pause in its recent downfall.
Momentum - The monthly RSI has turned bearish after exiting the overbought zone, signalling a loss of strength on the short- and medium-term charts. However, the index is sustaining below its 20-, 50-,100- and 200-day SMAs, reaffirming the short-term negative bias.
Direction - The sector's outlook remains bearish. Hence, a minor bounce back towards the supply zone can be considered an exit opportunity for traders.
Volatility - The weekly ATR has reached 2,763, suggesting a weekly range of 2,763 points for the consumer durable index. The ATR varies between 1,270 and 913 in the daily timeframe, indicating reduced momentum.
Volume - Stocks such as BLUE STAR, CROMPTON GREAVES, DIXON, and VOLTAS have recorded aboveaverage volumes compared to previous months, highlighting increased interest in specific counters.
Our Take - The index is in a short to medium-term downtrend. The immediate support zone is around the 52,500- 52,200 level; breaching this level may trigger profit booking toward the 50,000-47,500 levels. However, with the bullish major trend, short-term corrections near these support zones can serve as strategic buying and accumulation opportunities for long-term investors.

Trend - After a five-month downturn, the index has observed a sharp bounce back from its support zone of 18,100- 18,000 levels, reflecting short covering at lower levels.
Pattern - The index has formed a bullish candle in the monthly timeframe, indicating a short-term pause in the recent downfall.
Momentum - The monthly RSI(14) has turned bearish after exiting the overbought zone, accompanied by negative divergence, highlighting a loss of strength in the short- to medium-term timeframe.
Direction - The index is trading below its 20, 50, 100, and 200-day SMAs, indicating bearish sentiment in the short term.
Volatility - The weekly ATR has decreased to 809 points, suggesting the index's current weekly range of 809 points. On the daily timeframe, the ATR has consolidated between 527 and 178, signalling reduced volatility in the short term.
Volume - Stocks like BIKAJIFOODS, CCL and EMAMILTD have witnessed above-average volumes compared to previous months, showing heightened activity in select counters.
Our Take - Currently, the index is placed below its up-sloping trendline, which reconfirms bearish bias. The supply zone around the 19,500-20,000 level is critical resistance. Conversely, the vital support zone is around 18,000; any violation may cause further weakness at 17,500-16,800 levels. As the primary trend is bullish, investors should view these corrections as opportunities for buying and accumulation within the support zones for investment purposes.

Trend - The BSE IT Index has broken below its long-term upward-sloping trendline, which has been in place since March 2020. The breakdown in Feb’25, marked by a strong bearish candle, signals a shift in trend and indicates a negative bias.
Pattern - A small bearish candle formed in March suggests a temporary pause following February’s sharp decline. However, a breach below the March low of 35,152 could resume the downward momentum.
Momentum - The monthly RSI (14) is trending lower and remains below its signal line, confirming sustained bearish momentum and a lack of buying strength.
Direction - The index continues to face profit booking pressure and is approaching key support levels at 32,470 and 28,385, which represent the 38.2% and 50% Fibonacci retracement levels of the 10,937–45,792 rally (Mar’20 to Dec’24).
Volatility - The weekly ATR is quoted at around 1,487, which means the index currently has a range of 1,487 points for a given week. We have seen the ATR increase to 619 from 522 levels on the daily timeframe, indicating an increase in volatility in the shorter timeframe.
Volume - ACCELYA, EXPLEOSOL, INFOBEANS, KSOLVES, LTIM, LATENTVIEW, SUBEX, and TANLA recorded trading volumes above their 12-month average in March.
Our Take - The BSE IT Index has entered a corrective phase after breaching its long-term trendline. With clearly bearish momentum and subdued price action, further downside is likely if 35,152 is taken out. Key supports lie at 32,470 and 28,385—watch these levels for potential reversal cues.

Trend - The BSE Healthcare Index remains in a strong uptrend, characterised by a series of higher highs and higher lows on the monthly chart, indicating a sustained positive bias.
Pattern - After two months of profit booking from its all-time high, the index has formed a strong bullish candle, reaffirming support at the breakout zone near 36,000.
Momentum - The monthly RSI (14) is still below its reference line, suggesting mild profit booking. However, the indicator is beginning to turn upward, pointing to a potential momentum reversal.
Direction - The index is finding immediate support near last month’s low around 38,000. A breach below this level could lead to further downside towards 36,272 and 33,414, the 38.2% and 50% Fibonacci retracement levels of the Apr’23–Jan’25 rally (21,394 to 45,806). On the upside, resistance is seen at 43,500 and 45,800.
Volatility - The weekly ATR has reached 1,692, meaning the index currently has a range of 1,692 points for a given week. On the daily timeframe, we saw the ATR decrease from 1,097 to 605, indicating decreased volatility.
Volume - Stocks like ASTRAZEN, HESTERBIO, JBCHEPHARM, KOVAI, NH, NOVARTKIND, RAINBOW, SPARC, VIJAYA and VIMTALABS showed good volume in March.
Our Take - The BSE Healthcare Index remains structurally strong, with a bullish monthly candle reinforcing trend continuation. Momentum is showing early signs of recovery. 38,000 is immediate support—holding above it can drive a move toward 43,500–45,800. A breakdown could trigger a deeper retracement toward key Fibonacci zones. The broader trend remains intact, allowing investors to capitalise on further gains in the index.

Trend - The BSE Power Index remains in a strong uptrend within an ascending channel. It is currently testing the lower band of the channel, marking a critical inflection point.
Pattern - A strong bullish candle in March, closing above the channel's lower boundary, confirms that the index still respects trendline support. It also stood out as one of the month's best-performing sectors among BSE indices.
Momentum - The monthly RSI (14) remains below its reference line, reflecting ongoing profit booking. However, it is beginning to tilt upward, hinting at a possible momentum shift.
Direction - The 5,700 level is a crucial make-or-break zone. A rebound from here could reaffirm the ongoing uptrend, while a breakdown below may trigger a deeper correction.
Volatility - The weekly ATR is around 338, which means the index currently has a range of 338 points for a given week. On the daily timeframe, we saw the ATR increase from 80 to 134 levels, indicating an increase in volatility.
Volumes - ADANIGREEN, KEC and SIEMENS have registered higher volumes above 12 months’ average volumes in the previous month
Our Take - The BSE Power Index is holding the lower edge of its rising channel, with a bullish candle suggesting resilience. While momentum remains under pressure, early signs of recovery are emerging. 5,700 is the key level to watch—holding above it keeps the uptrend intact; a breakdown may lead to weakness.

Trend - The BSE Metal Index remains in a medium-term uptrend, forming higher highs and higher lows. However, over the past year, it has been in a range-bound phase, indicating a pause in momentum. The index continues to respect an upward-sloping trendline in place since early 2022.
Pattern - A strong bullish candle in the latest month signals renewed buying interest and respect for the trendline support. A bounce to the upside is likely as long as the index holds above this trendline. A close below it, however, could shift the bias to bearish.
Momentum - The monthly RSI (14) is on the verge of crossing above its reference line. A successful crossover would support a bullish outlook, while a rejection and reversal from this level would confirm a negative bias.
Direction - The index currently holds above the 23.6% Fibonacci retracement level of the 5,336–34,946 rally, placed near 28,580. This level, aligning with the trendline, forms a crucial support zone. Holding above this area indicates strength and continuation potential, while a break below it may trigger a deeper correction.
Volatility - The weekly ATR is at 1,480, indicating that the metal index currently ranges from 1,480 points for a given week. We have seen the ATR decrease from 2,121 to 493 on the daily timeframe, indicating decreased volatility in the shorter timeframe.
Volume - No stocks from BSE Metal had shown above-average volumes in the previous month
Our Take - The BSE Metal Index is at a key inflection point, holding above its upward trendline and critical Fibonacci support at 28,500. A strong bullish candle adds confidence to the uptrend. Momentum remains fragile; a positive RSI crossover will confirm strength, while failure may invite selling pressure. A break below support can shift the trend to bearish.

Trend - The BSE Oil & Gas Index has been trading within an ascending channel since Mar’20. In February, the index breached the lower band of this channel but rebounded strongly in March, re-entering the channel and suggesting that the broader uptrend remains intact as long as it holds above the lower band.
Pattern - A strong bullish candle formed in March marks a convincing pullback into the rising channel, reinforcing the continuation of the bullish structure, provided the index sustains above the channel support.
Momentum - The monthly RSI (14) is trending downward and remains below its reference line, signaling a bearish bias despite the price recovery.
Direction - The 22,000 level is key. A close below it may lead the index toward the 21,000 zone, which coincides with the 50% Fibonacci retracement of the 8,723–30,713 rally (placed at 21,172) and prior resistance-turned-support near 20,800. On the upside, resistance is seen in the 26,000–27,000 range.
Volatility - The weekly ATR is at 1,253, indicating that the Oil & Gas index currently has a range of 1,253 points for a given week. In the daily timeframe, ATR has decreased from 865 to 516, indicating reduced volatility in the shorter term.
Volume - No stocks from BSE Oil & Gas had shown above-average volumes in the previous month
Our Take - The recent pullback into the rising channel signals that the broader uptrend in the BSE Oil & Gas Index is still in play. However, weak RSI momentum suggests caution. Holding above 22,000 is crucial for sustaining the bullish view; a breach may drag the index toward the 21,000–20,800 support zone. Upside resistance lies between 26,000 and 27,000.
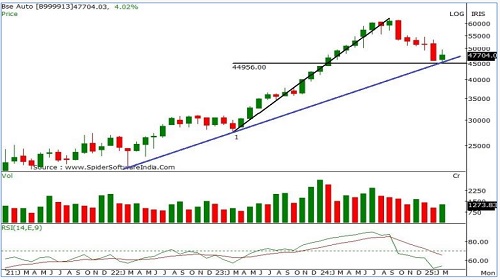
Trend - Since late March 2020, the BSE Auto Index has been in a steady uptrend, consistently respecting an upwardsloping trendline originating from the 21,083 level in Mar’22. This trendline also coincides with the 50% Fibonacci retracement level of the Mar’23–Sep’24 rally (27,468–62,443), currently placed near 44,956.
Pattern - The index has formed a small bullish candle with a minor upper shadow, reflecting selling pressure at higher levels. However, it continues to hold above the critical trendline support.
Momentum - The monthly RSI (14) is trending downward and remains below its signal line, suggesting sustained bearish momentum.
Direction - The 45,000 mark is a pivotal level. Sustaining above this could trigger a rebound, while a breakdown may extend the decline towards the next major support near 40,000.
Volatility - The weekly ATR is 1,926 points, indicating the index’s average weekly movement. During the daily timeframe, the ATR decreased from 1,234 to 770, highlighting a decline in volatility.
Volumes - BAJAJ-AUTO have shown above 12 months of average volume in March.
Our take - The BSE Auto Index holds above a key trendline and the 50% Fibonacci retracement level near 45,000, keeping the broader uptrend intact. However, the small-bodied candle with selling pressure and weakening monthly RSI indicate caution. Sustaining above 45,000 could trigger a bounce, but a breakdown may open room for a deeper correction toward 40,000
For More Axis Securities Disclaimer https://simplehai.axisdirect.in/disclaimer-home
SEBI Registration number is INZ000161633


.jpg)