Market Cap Categorisation Report Jan-Jun 2025 by Geojit Financial Services Ltd

Contents:
• Market Cap Shape & Cluster Analysis - Changes & Trends
• Market Cap Thresholds
• Market Cap Curve wise % Share & Comparison with 3 Year Avg
• Market Cap Category Elevations and Declines
• IPOs during latest 6 Months & Prominent Demerger(s) / Scheme of Arrangements (if any)
• Top 25 Largecap, Midcap, Smallcap, Microcap Stocks along with Market cap changes & Rank trend
• Top 10 & Bottom 10 Largecap, Midcap & Smallcap stocks – by % Change in Average Market cap in the latest 6 months
Notes & Key Definitions
AMFI (Association of Mutual Funds in India) reclassifies stocks by market capitalisation biannually, in January and July
Definition of Large Cap, Mid Cap and Small Cap:
To ensure uniformity with respect to the investment universe for equity schemes, SEBI / AMFI has defined large cap, mid cap and small cap as follows:
a. Large Cap: 1st - 100th company in terms of full market capitalization (6 mth average)
b. Mid Cap: 101st -250th company in terms of full market capitalization (6 mth average)
c. Small Cap: 251st company onwards in terms of full market capitalization (6 mth average)
Mutual Funds would be required to adopt the list of stocks prepared by AMFI in this regard and AMFI would adhere to the following points while preparing the list:
a. If a stock is listed on more than one recognized stock exchange, an average of full market capitalization of the stock on all such stock exchanges, will be computed ;
b. In case a stock is listed on only one of the recognized stock exchanges, the full market capitalization of that stock on such an exchange will be considered.
Subsequent to any updation in the list, Mutual Funds would have to rebalance their portfolios (if required) in line with updated list, within a period of one month.
Microcaps: In this report, we have referred Microcaps, where present, as an universe, that is beyond 500th rank in terms of Market Cap and in some data point those between 500th and 750th rank.
Average Market Cap Shape & Cluster Analysis
Average Market cap Growth – Highlights:
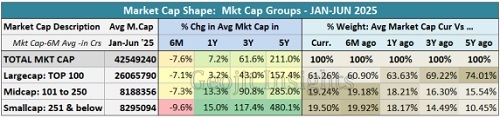
• Total Average Market cap for the period Jan-Jun 2025 stood at Rs. 425.5 lakh crs, 2 nd high, down -7.6% from previous block of 6 months, Jul-Dec ‘24.
• Market cap of Largecaps fell by -7.1% ; Midcaps by -7.3% ; Smallcaps by -9.6%.
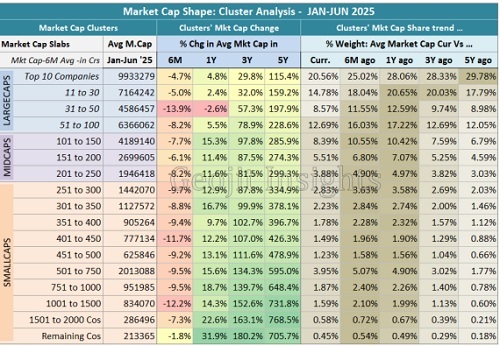
• Among the Largecap set, companies in Top-30 cluster fell lower, followed by Companies in 51 to 100 cluster. 31st to 50th rank companies fell the most by -13.9%.
• Among the Midcap-150 set, Mid-50 fell lower by -6.1%.
• In the Smallcap space, that is 251st company & onwards, most clusters suffered decline during the 6 months period. The set between 401 to 450 and those between 1001 to 1500 fell higher.
• Indian equities faced correction for the period spanning Oct ’24 till Feb/Mar ’25. In the Jan-Jun ’25 period, markets were seen recovering in the second half.
Market Cap Thresholds & Market Cap Weight highlights
Market Cap Thresholds:
• The thresholds points for companies in Largecap, Midcap, Smallcap, etc have evolved & expanded significantly over the past years, but faced a decline in the Jan- Jun ’25 period.
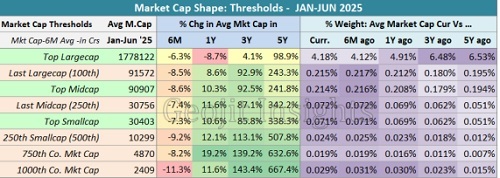
• The threshold point for Largecap now stands at Rs.91572 crs, down -8.5% in the past 6 mths ; up 8.6% YoY ; up 92.9% in 3 Yrs.
• Midcap entry point stood at around Rs.30756 crs, down -7.4% in 6M ; up 11.6% YoY ; up 87.1% over 3 yrs.
• In Smallcaps, the 250th cos’ market cap or 500th company of the listed universe stood at Rs.10299 crs, down -9.2% in 6 mths ; up 12.1% YoY ; up 113% in 3 yrs.
• 750th Co’s market cap now stands at around 4870 crs, down -8.2% in 6M and up 19.2% YoY and
• 1000th Company market cap was at 2409 crs, down -11.3% in 6M and up 11.6% YoY.
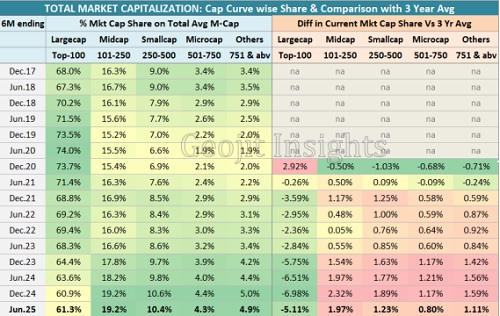
Market Cap Curve wise % Share & Comparison with 3 Year
Avg Average Market cap Weights – Highlights:
• Largecap’s weight in the Total market cap marginally increased during the period Jan-Jun ‘25 to 61.3% from around 60.9% in the previous 6M. It was 63.6% a year ago.
• Midcaps’ market cap share stayed at 19.2%, like in the previous 6M and up from 18.2% a year ago.
• Top-250 Smallcaps Market cap share stood at 10.4%, down from 10.6% in the prev. 6M. It was 9.8% a year ago.
• Microcap companies’ market cap share (ranking 501 to 750), slightly dipped to 4.3%, from 4.4% 6M ago.
• Overall Smallcaps’ market cap weight was at 19.5%, down from 19.9% in the last 6M reading.
• It should be noted that, Market Cap in the respective cap curves is also due to issues coming to public and new listings.
• In comparison, to the 3 year averages of the market cap curves, Largecaps are generally seen at a discount. Others appear to be at a premium going by the past Market Cap Spreads.
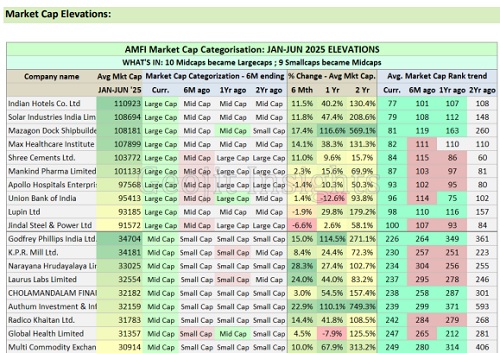
Market Cap Category: What’s In & What’s Out ?
Overall Highlights:
• It was an action packed period for Indian equities with many companies changing their market cap ranks, as a result of their growth or drop in value.
• Market Cap Category Elevations in Jan-Jun ‘25:
* 10 Midcaps companies became Largecaps
* 9 Smallcap companies became Midcaps
• Market Cap Category Declines in Jan-Jun ‘25:
* 11 Largecaps companies declined to Midcaps
* 11 Midcaps names declined to Smallcaps.
• Apart from the above prescribed market cap categories, there were major changes noticed within the Smallcap (those with M-Cap rank till 500) & Microcap (M-Cap rank from 501) segments.
• During the 6M period, an estimated Rs 1.59 lakh crs were added to the market cap through 34 IPOs.
* 29% Midcap (1 Co.)
* 71% Smallcaps (33 Cos) – of which atleast 29+ issues were in Microcap segment (mkt cap rank above 500), rising Rs 46600 Crs or 29%.
• Nearly 10 companies saw Demergers and spin offs taking place during the period, ranging from Siemens Energy in Largecap, ITC Hotels in Midcap, AB Lifestyle brand, Onesource Speciality Pharma (from Strides), etc in Smallcaps. The overall market cap of the demerged entities were pegged at 1.84 lakh crs.
• Around 7 cos is estimated to have got migrated from SME to Main Board in NSE & BSE, cumulatively adding a market cap of nearly Rs 8800 crs, all in Smallcap category.
For More Geojit Financial Services Ltd Disclaimer https://www.geojit.com/disclaimer
SEBI Registration Number: INH20000034