Indian equity benchmarks relatively outperformed global peers and settled the volatile week at 22,397, down by 155 points - ICICI Direct

Nifty :22397
Technical Outlook
Week that was…
Indian equity benchmarks relatively outperformed global peers and settled the volatile week at 22,397, down by 155 points. The market breadth was in favor of declines, with an A/D ratio of 1:2, as the broader market underperformed, where both the Nifty midcap index and the Nifty small cap index closed the week on a negative note, down by 2% and 4% respectively. Sectorwise, barring Financial Services all the sectors closed the week in red, while, IT, PSU Bank and Auto underperformed.
Technical Outlook:
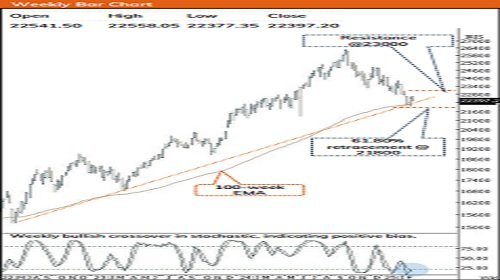
* The Nifty opened the truncated week on a flat note and traded the week within a narrow range of 360 points. As a result, the weekly price action formed a small bear candle, indicating consolidation.
* On the back of strong global cues, Nifty is likely to start the week on a strong footing. A key point to highlight in the last week is that despite global volatility, Nifty relatively outperformed by forming a higher low above 50% retracement of recent up move (21964- 22676). As a result, the index is now witnessing a slower pace of retracement, indicating a healthy retracement that suggests strength in the pullback. Going ahead, the key level to monitor is the 20-DEMA, which acts as an immediate hurdle. If the index sustains above this level, we expect a gradual recovery, opening the door for an extended pullback towards the 23000 mark. However, the lack of follow-through strength above last week’s high signifies prolonged consolidation in the broader range of 21800-23000, with stockspecific action dominating the trend. In the process, volatility is likely to persist, influenced by tariff-related developments and the upcoming FOMC meeting in the week. Meanwhile, 21800 will continue to serve as a key support level. Our view of a technical pullback is backed by the following observations:
* a. The ratio chart of Nifty/Dow Jones has recorded a breakout from a six-month falling channel, indicating the domestic market could relatively outperform US equities going forward.
* b. Over the past three decades, the average drawdown below the 52-week EMA as been 6-7%, followed by >20% returns over the next 12 months. The Nifty is currently ~6% below its 52-week EMA, supporting a potential recovery.
* c. Market breadth recently rebounded from a bearish extreme, as the % of stocks (within Nifty 500 universe) trading above their 50 and 200 days SMA dropped to 8 and 10, respectively. Historically, such bearish readings have paved the way for a durable bottom in the subsequent weeks.
* d. The cool off in US 10-year Yields, Dollar Index and Brent crude augurs well for emerging markets by easing inflation and boosting sentiment.
* e. The monthly stochastic oscillator is in the extreme oversold territory at 12 (lowest since 2002), indicating an impending pullback.
* On the broader market front, the Midcap and Small cap indices, witnessed supportive efforts in the vicinity of 61.80% retracement while protecting previous week’s low, indicating strength. Both the indices witnessed buying demand from the decade-long trendline (Adj Jan 08 high and Oct 21 high) coupled with a positive divergence of the RSI, suggesting that the midcap index could witness extended pullback toward 51500, while the small-cap index may reach 16000 levels. Hence, the focus should be on accumulating quality stocks (backed by strong earnings) in a staggered manner.
* The index has corrected >16% over the past five months, hauling it to a long-term rising trendline amid oversold conditions. We believe ongoing consolidation would help the index form a stage for the next leg of a pullback while absorbing tariff-related anxiety. The formation of a lower high-low signifies corrective bias, wherein strong support is placed around the 21800.
* a) A rising trendline drawn adjoining subsequent major lows off Jun-22 (15183) is placed at 21800. b) Support at 61.80% retracement (18837-26277) is in the vicinity of 21800. c) The 24-month EMA support is also positioned in the vicinity of 22000.
Nifty Bank : 48060
Technical Outlook
Day that was :
The Bank Nifty settled the truncated week on a negative note at 48060 , down by 0 .90 % . The Nifty PSU Banking index underperformed the benchmark and settled at 5784 , down by 2 .49 % .
Technical Outlook :
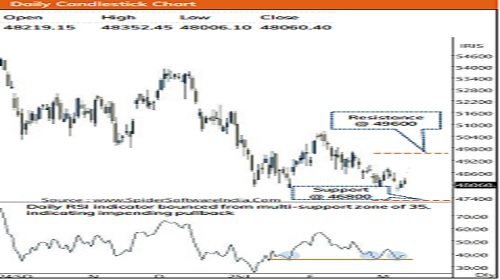
* The Bank Nifty opened the week on a negative note and observed range bound action, where it traded in a tight range of 900 points throughout the week . The price action created a small bear candle at the lower end of the broader consolidation range of 49600 -47800 .
* Going ahead, a decisive close above its previous weeks high (which is not the case since past 5 weeks) will be the initial sign of resumption in up move while the sustainability above the same will keep the pullback option open towards the upper end of the broader consolidation range (49600), coinciding with 52 -week EMA . Meanwhile, near -term support on the downside is placed at 46800 which is 61 . 8 % retracement of Oct -23 to Sept -24 rally (42105 -54467 ) . The daily RSI bounced from the multi -support mark of 35 from where it has experienced a pullback on multiple occasions, since over past two months .
* Key point to highlight is that, despite high volatility observed in last week amid US tariff concerns and the India as well as US Inflation data, the index managed to hold above the lower end of the broader consolidation range of (47800 ) for the fourth time in last two month on a closing basis, indicating resilience as domestic market is faring well compared to the global peers .
* Structurally, with 12 % correction already in place the index is witnessing a base formation near the lower band of 2 years rising channel, which is also in the vicinity of 100 -week EMA .
* In tandem with the benchmark index, the Nifty PVT Bank index is witnessing a slower pace of retracement as over past five weeks it has retraced only 80 % of preceding two weeks up move (23508 -25025), indicating relative strength . Going ahead, a close above the previous weeks high of 24329 will be the initial sign of the resumption in upward momentum, Meanwhile, immediate support is placed at 2350 0 which is in the vicinity of previous swing low .
Please refer disclaimer at https://secure.icicidirect.com/Content/StaticData/Disclaimer.html
SEBI Registration number INZ000183631


More News

Market is expected to open on a negative note and likely to witness a range bound move durin...