Indian equities fell for 2nd day, closing at 24,501, down 0.85% - ICICI Direct

Nifty : 24501
Technical Outlook
Day that was…
Indian equity benchmark extended the sell off for the second consecutive session tracking weak global cues and settled at 24501 down 0.85%. Market breadth was in favor of declines, with an A/D ratio of 1:2 where broader markets underperformed the benchmark. Both midcap and small cap indices underperformed the benchmark and closed on a negative note, 1.27% and 1.45% respectively. Sectorally, Barring Consumer Durables all indices closed on a negative note, where IT, Realty, and PSU bank were the laggards.
Technical Outlook:
* Nifty started the day on a weak note and selling got intensified post breaching of 100-day EMA, as a result the daily price action formed a bear candle, indicating extended correction.
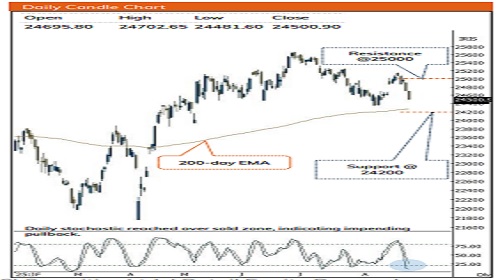
* Key point to highlight is that, Nifty closed in the vicinity of 80% retracement of the move from (24337-25153) it has been observed that since April 2025 most of the intermediate corrections has halted in the vicinity of 80% retracement. Further, since April 2025 the intermediate correction had been to the tune of max 3-4% with 2.50% correction already in place and Stochastics entered in oversold zone (11) a potential rebound can not be ruled out in the near term. Thus, investors should refrain from aggressive selling at current level. Going ahead to pause the current down move index need to close above previous sessions high failing to do so index will continue to consolidate in the range of 24200-25000. However, a decisive close and follow through buying above 25000 will fuel the upward momentum.
* We expect volatility to pick up tracking tariff development, and GDP numbers. Hence, focus should be on accumulating quality stocks backed by strong earnings, especially those poised to benefit from next-generation GST reforms and upcoming festive season as we believe strong support is placed at 24200 level which is 200-day EMA and 38.20% retracement of the move from (21743-25669).
* On the structural front, market appears to be absorbing host of negative news around tariff as well as geopolitical issues coupled with FII’s continuous sell-off, wherein Nifty has managed to defend 24500 on a weekly closing basis (over past 3 months).
* On the market breadth front the % of stocks above 50 days EMA has entered in the lower band of bull market phase (30-25) currently at 28 that offers incremental buying opportunity. Historically, buying in such scenario has made a base formation and garnered decent returns in subsequent months.
* Key monitorable to watch out for in current volatile scenario: a) Development of Bilateral trade deal negotiations. b) India GDP.
Nifty Bank : 53820
Technical Outlook
Day that was:
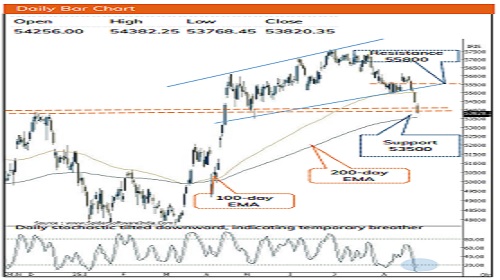
Bank Nifty closed on a negative note and settled at 53,820 (-1.16%). Nifty Pvt Bank index mirrored the benchmark, ending the day at 26,074(-1%)
Technical Outlook:
* Bank Nifty opened gap-down, recovered briefly in early trade, but later slipped into a lower-high, lower-low formation amid sustained selling pressure, which resulted in a formation of bear candle.
* The daily price action witnessed extension of its corrective bias in the lower-low-high pattern for the fifth consecutive days, reinforcing corrective bias
* Key point to highlight is that, bank nifty is in corrective phase from past eight weeks and currently approaching towards the 200-day EMA key support. Stochastic oscillator entering in oversold territory on both the daily and weekly time-frame, with reading of 6 and 10, indicating that the corrective phase approaching exhaustion and a potential rebound could not be ruled in the near term. Thus, investors should refrain from aggressive selling at current level. Further, with strong confluence support placed near 53,500 marked by the 200-day EMA, the polarity principle of prior resistance turning into support, and the 61.8% retracement of the 51,860–57,630 rally. Key point to watch out would be as index crosses above its previous day high with a follow through strength would result in the pause from the current downward move and open the possibility of a gradual recovery.
* Structurally Since April, intermediate corrections have remained shallow while the index has consistently held above its 100-day EMA. Moreover, over the past eleven weeks, the index has retraced 50% of the preceding up move from 51863 to 57614 (11%) in the previous six weeks, indicating a slower pace of retracement with a robust price structure, that augurs well for the next leg of the uptrend.
* PSU Bank Index has mirrored the benchmark and closed below the 100-day EMA which was been held firm since May 2025, indicating a pause in current uptrend. The index is approaching towards its previous multiple swing low support which coincides with the 200- day EMA placed near 6700, signals a supportive effort can emerge at this level
Please refer disclaimer at https://secure.icicidirect.com/Content/StaticData/Disclaimer.html
SEBI Registration number INZ000183631

