

Index rebounds near 61.8% retracement after weak open - ICICI Direct

Nifty :23123
The Indian equity benchmark maintained its winning streak for third consecutive day ahead of RBI policy. Nifty settle the day at 23123 up 155 points. Sectorally, barring PSU Bank all major indices closed in green wherein IT, Realty and Metals were the top gainers
Technical Outlook:
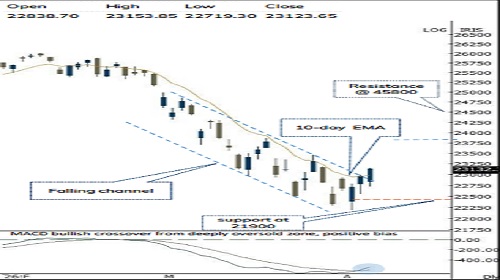
* Index opened the day on a negative note and witnessed buying demand in the vicinity of 61.8% retracement of previous session range. The daily price action resulted into bullish candle above 10-day EMA with long lower shadow, indicating supportive efforts emerging from elevated levels.
* Index is likely to witness gap-up opening on back of easing of geopolitical tensions, triggering improved global risk on sentiment and correction in crude oil prices. Going head, we expect index to old the recent panic low of 22200 and stage a strong recovery towards 24500 in the coming weeks. • Key highlight is that index has broken out above the falling channel formation and surpassed it previous week high. Additionally, over past three-session index has been forming higher high-low structure, while discounting host of negative news around geopolitical conflict, indicating pause in corrective phase.
* In current scenario, Nifty has already corrected ~16% from life time highs that hauled most of the momentum, sentiment as well as breadth indicators in bearish extreme readings. Historically, these oversold conditions have offered good entry opportunity for constructing medium-to-long-term portfolios.
Our constructive bias is based on following observations:
a) Historically, since 1996, there have been only 4 occasions where index has given a monthly negative close for more than 4 months in a row, post which index has staged a strong recovery in subsequent quarters. Currently, index corrected over 4 consecutive months
b) Such intermediate correction got arrested in the vicinity of long term 200 weeks EMA (barring 2001,2008, 2020), currently placed at 21930
c) Over past 25 years, there have been 8 occasions where bull market correction got arrested within 15-20% range with an average correction of 17%.
d) With the 16% decline (off Feb high of 26341), Nifty has hauled monthly stochastic oscillator in oversold territory (placed at 12). Further, the divergence on the daily chart (where price is making lower low while RSI is making corresponding higher lows) along with oversold placement of weekly and monthly stochastic oscillator signifies, waning of downward momentum.
e) On the Bank Nifty front, since Covid there have been six major correction which anchored around 20-22%. With 19% correction already in place amid oversold conditions, indicating that the downside approaching maturity, in line with historical corrective cycles.
f) In case of geopolitical events, past four decades data suggest that price wise median correction matures around 11%. Buying during such a panic scenario has garnered >25% returns in next 6 months.
g) Historically, durable bottoms are formed when the market breadth indicator approaches its bearish extremes. The current reading of % of stocks above 50 and 200 SMA (Nifty 500 universe) rhymes with the historical readings where index formed a durable bottom. Last week, only 15% of stocks were above their 50- and 200-days SMA and Net of daily advance-decline was at 440, signaling capitulated extremes. Post these extremes, the index has delivered a median rally of ~23% in the subsequent 6-12 months period.
Key Monitorable:
* De-escalation of geopolitical tension, Cool-off in crude oil, RBI Policy, Start of Q4-FY26 earnings, US Inflation.
Intraday Rational:
*Trend – Strong recovery amid cool off in crude oil prices signifies resumption of uptrend
*Levels – After gap up opening buy on dips around previous swing high of 23500
Nifty Bank :52716
The Bank Nifty Index concluded the day on a marginaly positive note tracking mixed global cues and rise in crude oil prices. BankNifty settle the day at 52716 up 0.2%.
Technical Outlook:
* The daily price action has resulted into bull candle with higher highhigher low and closed above short term moving average indicating buying demand at elevated base.
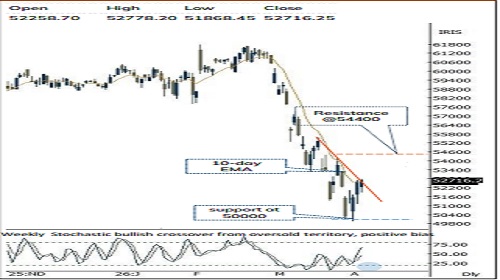
* Index is likely to witness gap-up opening on back of easing of geopolitical tensions, triggering improved global risk on sentiment and correction in crude oil prices. Going ahead we expect index to extend ongoing pullback towards 57000 being placement of 200 days EMA coincided with 61.8% retracement of entire correction from All Time High (61765-49955).
* Key highlight is that Index has closed above its short term falling trendline joining highs of 18th March (55554)and 25th March(54146). Also, Index has closed above 10-day EMA and previous week high for second consecutive day which has been acting as resistance since March 2026 indicating early signs of reversal. Meanwhile, strong support is placed around psychological mark of 50000 levels (being last weeks low).
* Further on the weekly timeframe, the stochastic oscillator has witnessed a bullish crossover from the oversold territory is at 19 levels, indicating positive momentum from deeply oversold conditions, with scope for a gradual pullback ahead. Therefore, one should avoid creating aggressive short position at current juncture , as technical pullback from current levels cannot be ruled out.
* On the broader space, the Nifty PSU Bank has formed Inside bar candle with previous session high-low range above 200-day EMA indicating breather. Next key (6800-9918) support is placed around 7400 being 80% Retracement of Sep-Feb 26 rally.
Please refer disclaimer at https://secure.icicidirect.com/Content/StaticData/Disclaimer.html
SEBI Registration number INZ000183631


More News

Market is expected to open on a flattish note and likely to witness range bound move during ...

