

Index opened weak, stayed volatile; minor bearish candle shows bull-bear tug-of-war - ICICI Direct

Nifty :25815
Technical Outlook
Day that was…
Indian equity benchmarks ended a volatile session on a flat note ahead of the US CPI data, with the Nifty settling at 25,815. Market breadth remained negative, with an advance–decline ratio of 1:2. Broader markets were largely range-bound, with both Midcap and Smallcap indices closing flat. Sectorally, IT stocks outperformed, while the rest of the sectors ended largely unchanged.
Technical Outlook:.
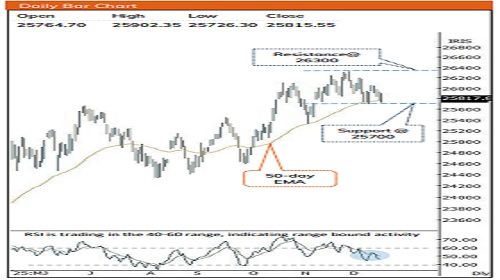
* The index opened on a weak note and remained highly volatile, oscillated by ~460-point intraday range. Consequently, the daily price action formed a minor bearish candle with wicks on both ends, highlighting a clear tug-of-war between bulls and bears amid event-led uncertainty.
* Despite the elevated volatility, the index continues to hold firmly above its 50-day EMA and the key swing-low support zone of 25,750–25,700, providing a cushion on the downside. As long as this support base remains intact and USDINR stabilizes, the possibility of a near-term pullback or consolidation cannot be ruled out, rather than a sharp corrective phase.
* A sustained breakout above 26,050 could act as a catalyst for the next leg of the up-move, potentially paving the way for a gradual retest of the all-time high near 26,300 in the coming weeks. In the interim, a buy-on-dips strategy remains prudent, with 25,700 emerging as a critical support level, offering a favourable riskreward for accumulating quality stocks.
Key Monitorable for the next week:
* Bank Nifty along with revival in IT and Oil & Gas would drive index higher as it carries >55% weightage in Nifty
* Since February 2016, USD/INR has been confined to a welldefined rising wedge and has historically exhibited a strong inverse correlation with the Nifty.
* Historically, there have been five instances where a retreat in USD/INR from the upper band of this wedge averaging a ~4% decline (with a maximum drawdown of ~7%) over a two-month period was followed by the Nifty delivering average gains of ~12% over the subsequent two months.
* With USD/INR currently hovering near the upper end of its longterm rising wedge, the setup closely mirrors these past inflection points, suggesting the potential for a similar cyclical rhythm to unfold
Intraday Rational:
* Trend- Supportive efforts in the vicinity of 50-day EMA, indicates positive bias intact.
* Levels: Buy on declines near 80% retracement of previous day upmove (25801-25980)
Nifty Bank : 58913
Technical Outlook
Day that was:
Bank Nifty extended correction for third consecutive day and closed at 58913, down 0.02%. The Nifty PSU Bank Index relatively outperformed gaining 0.1% closing at 8325 levels.
Technical Outlook:
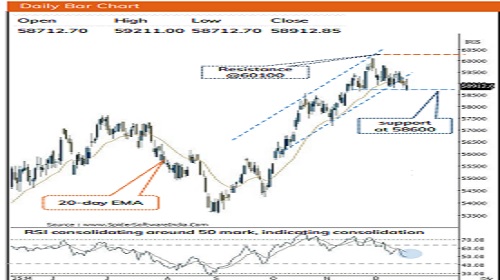
* Bank Nifty opened on negative note, and oscillated by > 1100 points range. Consequently, the daily price action formed bull candle with long upper shadow indicating profit booking at elevated levels.
* Over past 3 weeks index has retraced 50% of preceding rally (57158-60114)indicating healthy consolidation. Absence of decisive close above previous session high has resulted into prolonged consolidation. Hence, for a meaningful pullback to materialize, index need to decisively close above previous session high, which would help index to pause current corrective phase and gradually resolve higher to challenge its all-time high 60100.
* Structurally we have seen 17 days rally (57158-60114)got retraced by 38.2% in just 14 sessions indicating slower pace of retracement.
* Momentum oscillators continue to reflect a bullish bias, while short and medium-term moving averages remain in a steady upward slope, validating the ongoing trend. Any temporary pullback should be treated as a buying opportunity in high-quality banking names, particularly those that delivered solid Q2 earnings, as immediate support is placed near 58,600, corresponding with the 50% retracement of the current advance (57,157–60,114).
* The PSU Bank Index has retraced 61.8% of previous rally( 7678- 8665) which is 7% decline from peak indicating inherent strength, The stochastic indicators is in upward trajectory indicating positive momentum. Nevertheless, pullbacks should be viewed as accumulation opportunities, with strong support around 8,100, being 50-day EMA
Intraday Rational:
* Trend- Previous 2 weeks decline index has retraced 38.2% its preceding 5 weeks 5% up move, indicating healthy consolidation.
* Levels- Buy on declines near 80% retracement of previous day upmove (58917-59370)
 .
.
Please refer disclaimer at https://secure.icicidirect.com/Content/StaticData/Disclaimer.html
SEBI Registration number INZ000183631


More News
Daily Derivatives Report 18th December 2025 by Axis Securities Ltd


