Index is likely to open gap-down on back of weak global cues and rise in brent crude prices - ICICI Direct

Technical Outlook
Week that was..
Equity Benchmark extended losses over second consecutive week primarily driven by lack of clarity on geopolitical development. Nifty settled at 23367, down 0.75%. Midcap seen profit booking after two weeks up move while small cap remained flat. Sectorally, financials remained at forefront while FMCG, realty continued with its underperformance. Technical Outlook:
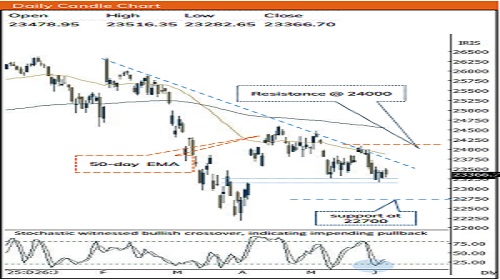
• In the absence of any decisive breakthrough on geopolitical front, the index extended its broad range consolidation 24000-23100 over fourth consecutive week wherein stock specific activity continued tracking better than expected earnings season. As a result, weekly price action formed a bear candle carrying lower high-low structure, indicating extended breather.
• Index is likely to open gap-down on back of weak global cues and rise in brent crude prices. We expect index to prolong the consolidation in the 24000-23100 zone. However, it is important to highlight that, with past eight sessions corrective move Index has approached lower band of consolidation placed at 23100 and now undergoing a base formation. Hence, a decisive close above previous session high of 23500 would be required to trigger a reversal toward 24,000 in coming weeks. Failure to do so would result into extended correction wherein strong support is placed at 22700 being 80% retracement level of April up move.
Our constructive bias on the index is based on following observations:
• Despite ongoing volatility Bank Nifty defended May lows and now showing early signs of structural revival
• Exempting Foreign Portfolio Investors (FPIs) from taxes on Indian Government Securities (G-Secs) indirectly benefits the equity market by stabilizing the rupee and lowering domestic borrowing costs. It is also positive for PSU banks due to fall in bond yields as they are generally big holders of Government securities.
• Broader market continues to outperform the large caps as evident by rising ratio line of Nifty 500 vs Nifty 100
• Seasonality favours buoyancy in the broader market. Over the past one decade, June has been positive month for Nifty Midcap and Smallcap on 70% of the time that garnered average gain of 2.5% and 3.5%, respectively
Key Monitorable:
a) Inflation: Upcoming US and India inflation data.
b) FII Inflows: Nasdaq, Kospi, Taiwan indices are witnessing negative divergence on the daily chart, indicating exhausted rally. The extended profit booking in these AI led indices may help to shift the FII’s interest from AI trade to growth oriented emerging markets like India
c) The pair of USD/INR has seen good correction after RBI’s move of exempting FPI from tax on any interest and capital gains on investment in Indian Government Securities. Further decline would help equities to revive momentum
d) Crude Oil: Any geopolitical de-escalation will cool oil prices, boosting Indian equities market
Nifty Bank : 54496
Technical Outlook
Week that was:
Bank Nifty Index closed the week on positive note at 0.47% at 54496. Nifty PSU Bank relatively outperformed for the week gaining 1.26%.
Technical Outlook:
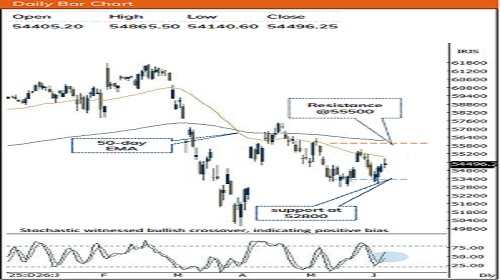
• Post gap-down opening Index defended lower band of consolidation and recovered on expected lines ahead of RBI policy .The weekly price action resulted into long legged doji like candle indicating buying demand from lower levels.
• Index is likely to witness gap down opening tracking weak global cues amid escalated geopolitical tension. BankNifty has relatively outperformed the benchmark and has approached the falling trendline joining highs of 21st April(57456) and 26th May(55536) coinciding with 50-day EMA around 55000 levels. Therefore, breakout from this level would open door towards 56,300 coinciding with previous swing high aligning with 200-day EMA and 80% retracement of recent decline (57456-52783)
• Structurally, index is witnessing slower pace of retracement as over past 6 weeks it retraced 61.8% of 3-weeks rally. Indicating healthy consolidation that would set the stage for next leg of rally.
• Nifty PSU Bank relatively outperformed forming Hammer like candle base formation above 52-week EMA. Follow through strength above last week high will lead to pullback towards 8600 levels being 61.8% retracement of current decline(9095-7800)
Intraday Rational:
• Trend- Higher high-low structure for three consecutive session, indicating positive bias
• Levels- Buy around 80% retracement of 3 days upmove
Please refer disclaimer at https://secure.icicidirect.com/Content/StaticData/Disclaimer.html
SEBI Registration number INZ000183631