In Q1FY26, Banks` Profits Buttressed By Treasury Gains by CareEdge Ratings
Synopsis
* The net profit of Scheduled Commercial Banks (SCBs) grew by 3.1% year-on-year (y-o-y) to Rs 0.92 lakh crore in Q1FY26, supported primarily by treasury gains (including one-offs by a large private sector bank), which offset the muted business growth and margin compression. Meanwhile, sequentially, SCB's net profit declined by 2.2%, attributable to margin pressures, tepid credit demand, and increased provisions.
* The net profit of Public Sector Banks (PSBs) recorded a y-o-y growth rate of 10.9%, as compared to Private Sector Banks (PVBs), which declined by 3.9% y-o-y, reaching Rs 0.47 lakh crore and Rs 0.45 lakh crore, respectively, in Q1FY26. This decrease in profits for PVBs is attributed to stress in microfinance and unsecured segments and increased provisions for some PVBs. In contrast, the rise in profits for PSBs is mainly attributed to treasury gains, strong recoveries from written-off accounts alongside growth in the housing segment for the larger players, and normalised operating costs.
* Return on Assets (RoA, annualised) of SCBs reached 1.28% in Q1FY26, declining by nine bps y-o-y and five bps sequentially due to margin compression (lower lending rates due to rate cuts and lagging deposit rates), and rising provisions.
* SCBs continued to remain adequately capitalised in Q1FY26, with median Capital Adequacy Ratio (CAR) increasing by 145 bps y-o-y.
* PSBs’ and PVBs median Common Equity Tier-1 (CET-1) ratio improved by 187 and 72 bps y-o-y to 15.3% and 15.6% respectively, with higher retained earnings and reserves bolstering the capital base the pace of risk-weighted asset growth remained relatively moderate.
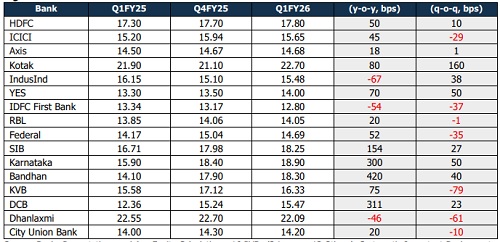
* The median CAR of both PSBs and PVBs increased by 108 bps and 62 bps y-o-y to 17.7% and 17.1%, respectively, supported by capital raising through bond issuances.
PSBs Lead the way since the last Four Quarters in Net Profits
Figure 1: PSBs’ Net Profit Trend (Rs Lakh, Cr)
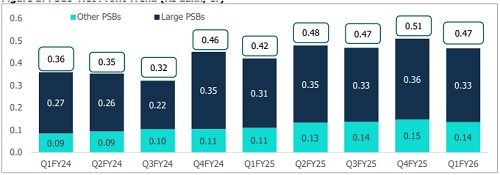
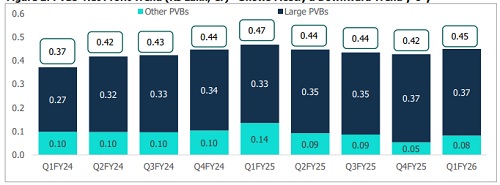
Figure 2: PVBs’ Net Profit Trend (Rs Lakh, Cr)- Shows Mostly a Downward Trend y-o-y
* Net profit for SCBs saw a growth of 3.1% y-o-y to Rs 0.92 lakh crore in the quarter, owing to a significant rise in treasury income (including one-offs), which were offset by rising provisions.
* PSBs exhibited robust growth and recorded an increase of 10.9% y-o-y to Rs 0.47 lakh crore. PSBs’ profitability was significantly buoyed by treasury gains; The gains were due to softening bond yields and rate cuts. Additionally, PSBs’ relatively lower CD ratios provided greater lending headroom, enabling portfolio expansion. In contrast, PVBs saw a decline of 3.9% y-o-y to Rs 0.45 lakh crore in Q1FY26, majorly attributable to stress in microfinance and the unsecured segment and increased provisioning for several PVBs.
Figure 3: Movement of RoA for SCBs (annualised, %)
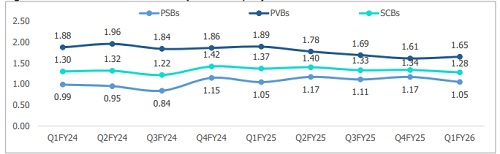
* RoA of SCBs decreased by nine bps y-o-y to 1.28% in Q1FY26, driven by margin pressures and stress in select segments. Sequentially, it witnessed a downtick of six bps attributed to higher provisioning in the current quarter. Meanwhile, gains in PSB profitability have cushioned the impact of moderating PVB returns, resulting in steadier system-wide RoA.
* PSBs’ RoA remained flat on a y-o-y basis at 1.05% in Q1FY26, as treasury gains offset margin compression and modest loan growth.
* PVBs’ RoA slipped by 24 bps y-o-y to 1.65% in the quarter, driven by elevated slippages in the microfinance and unsecured segments. Sequentially, PVBs' RoA improved by four bps, mainly attributable to significant growth in the other income due to one-off gains observed by one large PVB and stable opex.
Figure 4: Movement of RoA for PSBs (annualised, %)
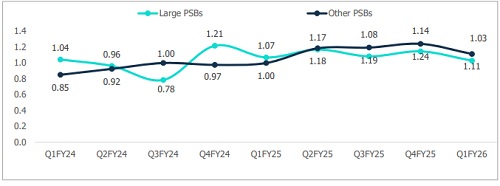
Figure 5: Movement of RoA for PVBs (annualised, %)
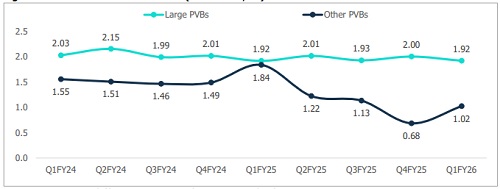
Sequentially, RoA for other PVBs improved by 34 bps q-o-q to 1.02% in Q1FY26, aided by the absence of the oneoff drag from a bank reporting losses in Q4FY25.
Overall, Capital Adequacy remains above the required levels in Q1FY26
Figure 6: CET-1 Ratio Median (%) – Banks Stand Much Above the Required Level
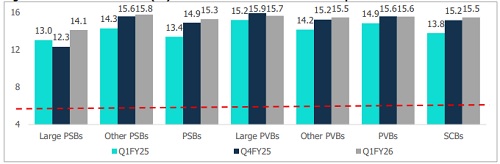
The median Common Equity Tier 1 (CET-1) ratio of SCBs touched 15.5% in Q1FY26, marking an increase of 168 bps y-o-y and 31 bps sequentially, primarily attributed to improved profitability leading to higher retained earnings, an increase in lower-risk-weighted assets like retail mortgages, and capital strengthening by banks.
Figure 7: CAR Median (%): Banks Continue to Remain Above the Required Level Regulatory Requirement
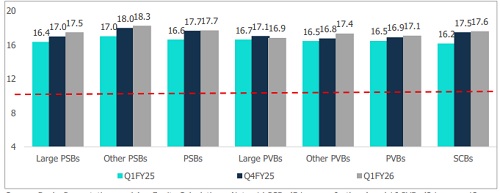
* The median CAR of SCBs improved by 145 bps y-o-y and 13 bps sequentially to 17.6% in Q1FY26 and remained well above the regulatory requirement of 11.5%, driven by profitability growth for banks and capital raising via bonds. Additionally, there is a favourable shift in the asset mix toward lower-risk-weighted categories, such as retail secured loans.
* The median CAR for PSBs rose significantly by 108 bps y-o-y to 17.7% for Q1FY26, while for PVBs, the median CAR rose more modestly by 62 bps y-o-y to 17.1%, as a faster increase in risk-weighted assets partly offset capital growth. This expansion in the capital levels was supported by growth in profitability. Additionally,
* The median CAR of SCBs improved by 145 bps y-o-y and 13 bps sequentially to 17.6% in Q1FY26 and remained well above the regulatory requirement of 11.5%, driven by profitability growth for banks and capital raising via bonds. Additionally, there is a favourable shift in the asset mix toward lower-risk-weighted categories, such as retail secured loans.
* The median CAR for PSBs rose significantly by 108 bps y-o-y to 17.7% for Q1FY26, while for PVBs, the median CAR rose more modestly by 62 bps y-o-y to 17.1%, as a faster increase in risk-weighted assets partly offset capital growth. This expansion in the capital levels was supported by growth in profitability. Additionally, substantial internal accruals from earnings have bolstered reserves, while additional capital has been mobilised through bond issuances and capital infusions.
Figure 8: Movement in PSBs’ CET-1
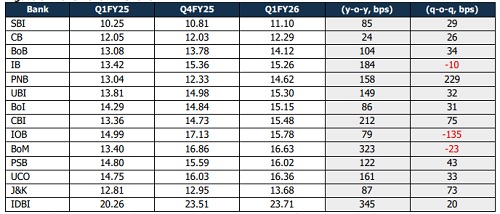
Figure 9: Movement in PVBs’ CET-1
Conclusion
According to Sanjay Agarwal, Senior Director, CareEdge Ratings, “In Q1FY26, SCBs saw a growth in net profit by 3.1% y-o-y. Supported primarily by treasury gains (including one-offs by a large private sector bank), which offset the muted business growth and margin compression. As treasury support fades due to bond yields stabilising, a sharper focus on earnings and asset quality will be critical to maintain profitability in the coming quarters. Despite policy rate cuts, elevated deposit rates have kept funding costs high and led to slower CASA and NII growth, thereby putting pressure on NIMs. While the deposit rates have come off in the last couple of months, the impact of the same on NIM compression and rising credit costs would further weigh on the profitability of SCBs. With the festive season approaching and credit demand picking up, banks are expected to recover momentum in the second half of the fiscal year.”
According to Saurabh Bhalerao, Associate Director, CareEdge Ratings, “PSBs have outpaced PVBs, aided by a lower base and relatively lower credit-deposit (CD) ratios, which created greater lending headroom. In the microfinance segment and other small-ticket loans, the asset quality issues remain aggravated, mainly for PVBs. The first quarter typically remains subdued for banks due to seasonal and weather-related factors. Meanwhile, banks have maintained comfortable capital adequacy, with many institutions reporting ratios well above regulatory thresholds, underpinned by robust bond issuances, capital infusions through Qualified Institutional Placements (QIPs), and plans for further bond raising in the upcoming fiscal year.”
Annexure
Above views are of the author and not of the website kindly read disclaimer