Gold trading range for the day is 70925-72035 - Kedia Advisory

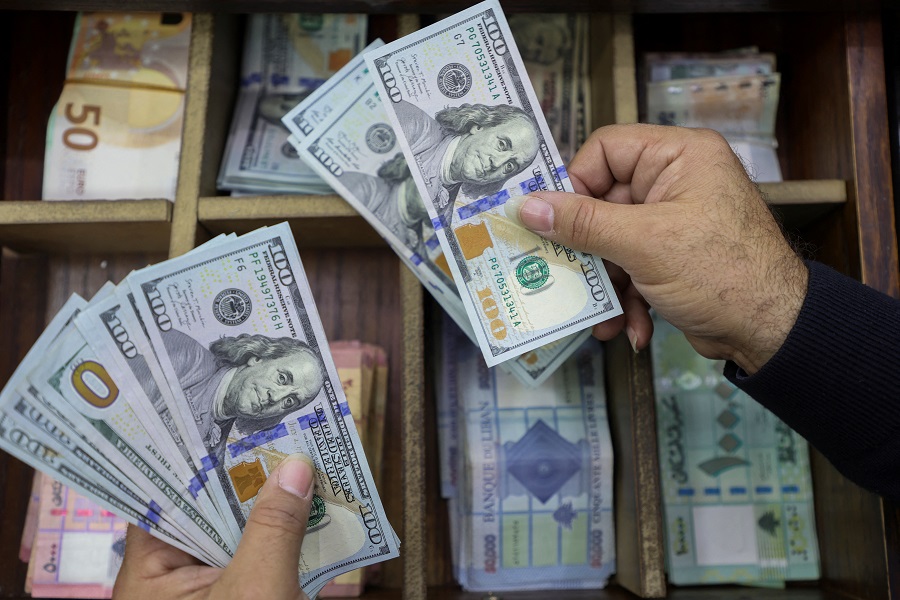
Gold
Gold prices edged up by 0.14% to settle at 71602, reflecting market anticipation of a busy week ahead with significant U.S. economic data releases. Last week, prices dipped amidst waning expectations for early U.S. interest rate cuts in 2024. Investors now foresee only a single cut this year, potentially in November, according to the CME's FedWatch tool. Attention is focused on the Federal Reserve's policy meeting and the U.S. non-farm payroll data scheduled for release later in the week. The Fed is widely expected to maintain its benchmark interest rate within the range of 5.25% to 5.5% at the upcoming meeting. Rising gold prices have impacted consumer participation in the local market, leading to narrower discounts and weaker imports. However, India has witnessed sustained physical demand from investors and significant purchases from the central bank, as highlighted by Kavita Chacko, Research Head for India at the World Gold Council (WGC). Record-high gold prices have been primarily fueled by risk and momentum trades, reflecting global market sentiments. In fiscal year 2023-24, net inflows into Indian gold ETFs surged to INR52.4 billion, nearly nine times higher than the previous fiscal year. Despite this substantial increase, net inflows remained 24% below the record levels seen in 2020-21. From a technical perspective, the gold market experienced fresh buying activity, with open interest rising by 0.28% and prices climbing by 102 rupees. Support for gold is expected at 71260, with potential downside towards 70925. Conversely, resistance is likely to materialize around 71815, with a breakout potentially pushing prices towards 72035.
Trading Ideas:
* Gold trading range for the day is 70925-72035.
* Gold steadied as market participants are bracing for a very busy week for U.S. economic data
* US non-farm payrolls report due on Friday
* Citi: strong demand in China supports higher gold price floor
Silver
Silver prices closed marginally lower by -0.02% at 82483 as investors awaited key events such as the Federal Reserve policy meeting and U.S. non-farm payrolls data for policy signals. While U.S. PCE readings met expectations, indicating ongoing inflationary pressures, the GDP report hinted at potential economic vulnerabilities, with Q1 2024 growth at its lowest in two years. This led to a revision in market expectations, with traders now anticipating a single Fed rate cut in 2024, down from earlier projections. Futures markets are pricing in a 60% probability of a rate cut in September, according to the CME FedWatch tool. The Fed is expected to maintain its current interest rate range of 5.25%–5.5% and signal no immediate urgency for rate adjustments, potentially dampening the appeal of non-yielding metals like silver and exerting downward pressure on prices. In addition to economic factors, geopolitical tensions in the Middle East contributed to market sentiment. Hamas reviewed an Israeli proposal for a cease-fire in Gaza, amid Egypt's efforts to broker an agreement and avert further conflict. Traders are closely monitoring developments in the region for potential impacts on market stability. Technically, the silver market experienced fresh selling pressure, with a notable increase in open interest by 13.41% to settle at 23,819 contracts. Despite a decline of -13 rupees in prices, immediate support is identified at 82030, with further downside potential towards 81575. Conversely, resistance is anticipated at 82815, with a breakout potentially leading to a test of 83145. Traders are advised to closely monitor these factors for potential trading opportunities.
Trading Ideas:
* Silver trading range for the day is 81575-83145.
vSilver dropped as investors waited for Fed policy meeting and U.S. non-farm payrolls data.
* US PCE readings broadly aligned with forecasts but signaled persistent inflationary pressures.
* The GDP report hinted that the US economy might not be as resilient as previously thought
crude oil
crude oil prices experienced a decline of -1.43%, settling at 6899 amid several influencing factors. The primary driver was the progress in Israel-Hamas ceasefire talks, alleviating concerns about a broader conflict in the Middle East. Additionally, U.S. inflation data revealed a moderate increase in March, which tempered expectations for imminent interest rate cuts. This dampened investor sentiment as lower inflation typically correlates with increased likelihood of rate cuts, which stimulate economic growth and oil demand. The prospect of interest rate hikes by the Federal Reserve gained traction as inflation and labor market indicators remained resilient, prompting investors to cautiously adjust their expectations. Money managers responded by reducing their net long U.S. crude futures and options positions, according to the U.S. Commodity Futures Trading Commission (CFTC). The International Energy Agency (IEA) revised down its forecast for 2024 oil demand growth, attributing it to lower consumption in OECD countries and a slowdown in factory activity. The IEA's downward revision by 130,000 barrels per day (bpd) for this year reflects the impact of subdued demand, even as China's oil imports surged after COVID-19 restrictions eased. From a technical standpoint, the market exhibited signs of fresh selling with an increase in open interest by 2.63% to settle at 5846, coupled with a price decrease of -100 rupees. Crude oil is currently finding support at 6855, and a breach below this level could lead to a test of 6812. Conversely, resistance is anticipated at 6973, with a potential upside move towards 7048 upon breaching this level.
Trading Ideas:
* Crudeoil trading range for the day is 6812-7048.
* Crude oil dipped as Israel-Hamas ceasefire talks tempered fears of a wider Middle East conflict.
* Investors are cautiously pricing a higher probability that the Fed could hike interest rates by a quarter percentage point this year.
* Money managers cut their net long U.S. crude futures and options positions in the week to April 23
Natural gas
Natural gas surged by 5.11% to settle at 168.7 amidst several factors influencing market dynamics. Increased feedgas to the Freeport LNG export plant, coupled with a decline in output, contributed to heightened market activity. Flowing natural gas to U.S. LNG export plants saw a significant uptick, reaching a three-week high, with Freeport LNG in Texas leading the surge by pulling in more feedgas. The boost in feedgas signaled a potential recovery from recent outages, instilling optimism among traders. Additionally, the U.S. Energy Information Administration (EIA) reported a bullish injection of 92 billion cubic feet (bcf) into storage, surpassing expectations. However, gas output in the Lower 48 U.S. states witnessed a decline, averaging 96.8 bcfd in April compared to 100.8 bcfd in March. This drop reflects broader industry trends, with U.S. gas production decreasing by approximately 10% in 2024 due to operational adjustments by energy firms like EQT and Chesapeake Energy in response to subdued prices earlier in the year. From a technical standpoint, the market observed short covering, with a notable decrease in open interest by -24.43% to settle at 33,624 contracts. Despite this, prices surged by 8.2 rupees, indicating underlying bullish momentum. Immediate support for natural gas is identified at 162.2, with potential downside tests towards 155.8. Conversely, resistance is anticipated at 172.8, with a breakout potentially leading to a test of 177.
Trading Ideas:
* Naturalgas trading range for the day is 155.8-177.
* Natural gas gains amid an increase in feedgas to the Freeport LNG export plant and a drop in output.
* US natgas flows rise to 3 – week high as Texas Freeport pulls in more fuel – LSEG
* EIA said utilities injected 92 billion cubic feet (bcf) of gas into storage
Copper
Copper surged by 1.86% to settle at 873.95, propelled by concerns over supply dynamics, notably highlighted by BHP Group's bid for Anglo American. Despite signs of subdued demand in China, which is the largest consumer of copper, prices fell short of reaching a record peak. The rally in copper prices has been largely fueled by market expectations of tight supplies and increasing demand from various sectors, including the energy transition towards electric vehicles and the adoption of new technologies such as artificial intelligence and automation. Evidence of weakening demand in China is apparent in the significant buildup of copper stocks in warehouses monitored by the Shanghai Futures Exchange, reaching levels close to four-year highs. The contrast between supply concerns and demand pressures underscores the intricate balance influencing copper prices. According to the International Copper Study Group (ICSG), the global copper market is projected to experience a surplus of 162,000 metric tons in 2024, with a smaller surplus of 94,000 tons forecasted for 2025. Despite this, world refined copper production is expected to increase by approximately 2.8% in 2024 and 2.2% in 2025, driven by anticipated recovery from operational challenges faced in 2023. Technically, the copper market witnessed fresh buying activity, as evidenced by a significant increase in open interest by 9.68%. Prices rose by 16 rupees, signaling bullish momentum. Support for copper is expected at 864.2, with potential downside towards 854.5. On the upside, resistance is likely to materialize around 880, with a breakout potentially pushing prices towards 886.1.
Trading Ideas:
* Copper trading range for the day is 854.5-886.1.
* Copper gains driven by supply concerns highlighted by BHP Group's bid for Anglo American
* Global copper market set for 162,000 ton surplus in 2024 – ICSG
* China's CMOC Q1 copper production jumps 123%
Zinc
Zinc prices surged by 3.31% to settle at 260.65, driven by a combination of fund buying and supply concerns. Market sentiment was buoyed by data indicating a rise in China's refined zinc production, coupled with positive signals from both Chinese and US manufacturing sectors. China, the world's largest zinc consumer, saw factory activity expand at its fastest pace in over a year, mirroring similar growth in the US and Germany. This upbeat outlook is further supported by research agency BMI's forecast of continued rebound in refined zinc production for 2024, following widening production deficits in previous years. Despite expectations of a surplus in zinc production for 2024, driven by increased output and the anticipated resumption of operations at key facilities like Glencore’s Nordenham smelter and Norway’s Odda mine expansion, market participants remain focused on the potential impact of supply-demand dynamics. Global zinc consumption is expected to rise, albeit modestly, in 2024, although this growth is overshadowed by sluggish global economic expansion. From a technical perspective, the market witnessed fresh buying momentum, with a notable increase in open interest by 18.96% to settle at 4,305 contracts. Prices surged by 8.35 rupees, indicating underlying bullish sentiment. Immediate support for zinc is identified at 255.3, with potential downside tests towards 249.9. On the upside, resistance is anticipated at 263.8, with a breakthrough potentially leading to a test of 266.9.
Trading Ideas:
* Zinc trading range for the day is 249.9-266.9.
* Zinc prices gained amid fund buying and worries about supply.
* Research agency BMI, said refined zinc production growth will continue to rebound in 2024.
* The anticipated resumption of Glencore’s Nordenham smelter and Norway’s Odda mine expansion later in the year is set to bolster global zinc production.
Aluminium
Aluminium prices experienced a notable uptick of 0.93% to settle at 237.75, driven by supply concerns stemming from sanctions on Russian metals. Washington and London's moves to prohibit the London Metal Exchange (LME) and Chicago Mercantile Exchange (CME) from accepting new Russia-made aluminium, copper, and nickel contributed to market apprehensions. LME daily data revealed ongoing investor requests to withdraw metal from LME-registered warehouses, resulting in dwindling aluminium stocks to 171,200 tonnes, marking the lowest level since August 2022. China's robust demand for aluminium was evident, with imports surging by 89.8% to 380,000 metric tons in March, and first-quarter imports totaling 1.1 million tons, up 92.3% year-on-year. Concurrently, China's primary aluminium output in March increased by 7.4% compared to the previous year, reaching 3.59 million metric tons, fueled by rising prices and growing industry profits. The expansion of China's manufacturing activity for the first time in six months further bolstered demand for aluminium, given its wide-ranging applications in sectors such as automotive, construction, and packaging. From a technical standpoint, the aluminium market witnessed fresh buying, with open interest rising by 6.22% and prices increasing by 2.2 rupees. Support for aluminium is anticipated at 234.7, with potential downside towards 231.7. Conversely, resistance is likely to manifest around 239.5, with a breakout potentially pushing prices towards 241.3.
Trading Ideas:
* Aluminium trading range for the day is 231.7-241.3.
* Aluminium prices gains on supply concerns.
* LME aluminium stocks reduced to 171,200 tonnes, representing the weakest level since August 2022.
* China's March aluminium imports jump 90% on – year
Cotton candy
Cotton candy prices saw a modest uptick of 0.55% to settle at 58660, fueled by robust demand for Indian cotton from key buyers like Bangladesh and Vietnam. The USDA's weekly export sales report highlighted a substantial increase in net sales for the 2023/2024 season, reflecting a surge of 79% from the previous week and 64% from the prior four-week average. Despite this positive momentum, upward movement was tempered by expectations of improved crops in countries such as Australia. The International Cotton Advisory Committee (ICAC) projected growth across various metrics for the next season, 2024-25, including increases in production, consumption, and trade. However, India's cotton stocks are anticipated to decline by nearly 31% in 2023/24, reaching their lowest level in over three decades due to decreased production and rising consumption. This reduction in stockpiles could limit exports from the world's second-largest producer and support global prices, but it may also exert pressure on the margins of local textile companies. Looking ahead, India's cotton production for the current season is expected to decrease slightly, while consumption is projected to rise. The country's cotton exports are forecasted to increase, reflecting strong international demand. In addition, China's cotton imports for the marketing year 2024/25 are estimated to rise significantly, driven by higher demand for textile and apparel products domestically and internationally. From a technical perspective, the cotton candy market witnessed short covering, with a drop in open interest by -2.91% and prices increasing by 320 rupees. Support for cotton candy is expected at 58580, with potential downside towards 58490. Conversely, resistance is likely to materialize around 58780, with a breakout potentially pushing prices towards 58890.
Trading Ideas:
* Cottoncandy trading range for the day is 58490-58890.
* Cotton gains as demand for India cotton continues to be strong from buyers
* India's cotton stocks set to plunge 31% y/y to lowest in decades
* Cotton stocks at the end of 2023/24 marketing year could fall to 2 million bales - CAI
* In , a major spot market, the price ended at Rupees dropped by percent.
Turmeric
Turmeric prices saw a marginal decline of -0.25% to settle at 18982, driven by expectations of new arrivals from the Marathwada region in Maharashtra. However, downside pressure was limited due to below-normal supplies and active festive demand. The market observed an increase in new crop arrivals, particularly in Nanded, Nizamabad, and Erode, with reports indicating higher arrivals compared to the previous week. Despite this, turmeric production for the 2023-24 season is estimated to be lower than the previous year, primarily due to demand destruction as prices surged. Turmeric exports during Apr-Feb 2024 witnessed a slight decline of 4.42% compared to the same period in the previous year, while imports decreased by 15.36%. However, there was a notable increase in imports in February 2024 compared to January 2024 and February 2023, indicating fluctuating trade patterns. From a technical standpoint, the market experienced fresh selling pressure, with open interest gaining by 0.83% to settle at 19350 contracts. Despite a decrease in prices by -48 rupees, immediate support for turmeric is identified at 18616, with potential downside tests towards 18248. On the upside, resistance is expected at 19376, with a breakthrough potentially leading to a test of 19768. Overall, turmeric prices faced downward pressure amid expectations of increased arrivals and lower production estimates for the current season. Traders are advised to closely monitor supply dynamics, trade data, and technical indicators for potential trading opportunities in the turmeric market.
Trading Ideas:
* Turmeric trading range for the day is 18248-19768.
* Turmeric dropped as new arrivals are expected from the Marathwada region in Maharashtra.
* However, downside seen limited amid below normal supplies and active festive demand.
* The Ministry of Agriculture first advance estimate for turmeric production in 2023-24 is estimated at 10.74 lakh tonnes
* In , a major spot market, the price ended at Rupees dropped by percent.
Jeera
Jeera, or cumin, faced a decline of -0.73%, settling at 22535, as the market contended with the possibility of increased arrivals putting pressure on prices. However, the downside was mitigated by global buyers' preference for Indian jeera amidst tightening global supplies. The influx of 10,000 to 12,000 bags of jeera daily in the Rajkot Mandi outpaced demand, with new arrivals observed in both Gujarat and Rajasthan in recent weeks. Notably, favorable weather conditions and increased sowing areas in major cumin-producing regions of India led to a significant surge in production. Gujarat alone is estimated to have produced a record 4.08 lakh tonnes of cumin, while Rajasthan also saw a notable increase in production by 53%. This surge in production, coupled with volatile domestic prices, impacted cumin exports in 2023, which witnessed a decline of 23.75% compared to the previous year. However, analysts anticipate a rebound in exports for 2024, given the increased sowing areas and declining international cumin prices. Technically, the jeera market experienced long liquidation, with a drop in open interest by -7.97% and prices declining by -165 rupees. Support for jeera is anticipated at 22410, with potential downside towards 22270. On the upside, resistance is likely to manifest around 22690, with a breakthrough potentially pushing prices towards 22830. The balance between supply dynamics, export trends, and technical factors will continue to shape jeera's price trajectory in the near term.
Trading Ideas:
* Jeera trading range for the day is 22270-22830.
* Jeera dropped as there is a possibility of further increase in arrivals pressure in the market.
* There will be a huge increase in cumin exports, which will reach about 14-15 thousand tonnes in February 2024.
* New arrivals have started in Gujarat since last 20-25 days and new arrivals have started in Rajasthan also since last 15 days.
* In Jodhpur, a major spot market, the price ended at 24000 Rupees dropped by 0 percent.
Views express by all participants are for information & academic purpose only. Kindly read disclaimer before referring below views. Click Here For Disclaimer