Equity benchmark concluded the volatile session on a negative note ahead of FOMC meeting - ICICI Direct

Nifty : 25936
Technical Outlook
Day that was…
Equity benchmark concluded the volatile session on a negative note ahead of FOMC meeting. Nifty declined 0.11% to settle the session at 25,936. The broader market breadth turned negative with A/D ratio 1:1.5 as all sectoral indices, barring Metals and PSU Banks, ended in the red, indicating broad-based profit booking ahead of key global cues.
Technical Outlook:
* Nifty started the session on a positive note, however the index witnessed heightened volatility, oscillating ~700 points throughout the day. Consequently, the daily price action formed a Doji candle with wicks on both ends, indicating tug-of-war between bulls and bears ahead of key global events.
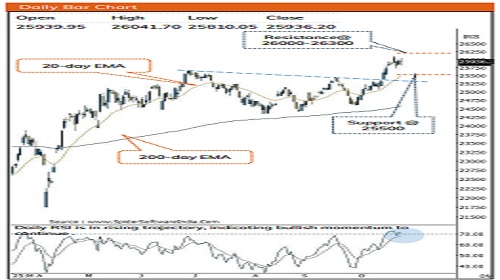
* Key point to highlight is that, index is consolidating above its previous breakout level from a 12-month falling trendline and forming higher base above it, indicating a structural improvement and strengthening of the ongoing uptrend. Additionally, on the momentum front, the RSI in all major time frames is sustaining above the 60 mark, indicating strong bullish momentum. Going ahead, we believe index to resolve higher and challenge its all-time high 26,300 in coming month. Hence any dips from current level should be viewed as a buying opportunity to accumulate quality stocks with robust earnings as strong support is placed at 25500 being 38.2% retracement of the ongoing up move (24,587-26,104) and 20-day EMA .
Our positive bias is further validated by following observations:
* The Breakout from 3 months consolidation helped Bank Nifty to clock a fresh All Time High, highlighting structural improvement. While optimism around earning boosted sentiment in IT, Oil & Gas stocks. Together, these indices carry 55% weightage of Nifty
* The ongoing up move is supported by improving market breadth, as the ratio of stocks hitting new 52-week highs to lows in the Nifty 500 continues to rise, confirming a strengthening rally.
* The breakout from a 4-month range (25,670–24,350), led by index heavyweights, signals structural improvement and sets the stage for the next leg of the rally.
* Nifty has been maintaining the rhythm of witnessing rally after approaching maturity of price and time wise correction. As Nifty has rallied 18% off April low, within which intermediate corrections arrested within 3-5% range. Meanwhile, timewise, over past three decades, there have been 12 instances wherein index has staged a strong rebound after consecutive 8 sessions negative close, garnering 7% rolling return in a month. In current scenario, index has rallied ~5%
Key Monitorable for the next week:
* Outcome of India-US tariff negotiations
* US Fed meet
* Progression of Q2FY26 earning season
* Continuation of buying spree from FII’s
* Gold: Gold has taken a breather after approaching overbought conditions after > 60% rally seen in this year. Going ahead, we expect gold to undergo healthy consolidation in $4400-$3800 range
Intraday Rational:
* Trend- Higher high-low formation confirms positive momentum
* Levels: After a positive opening utilize declines towards previous session low for Initiate long position
Nifty Bank : 58214
Technical Outlook
Day that was:
Bank Nifty closed the volatile session on a positive note and settled at 58,214 up 0.17%. The Nifty PSU Bank index has relatively outperformed the benchmark, ending the day strong at 8,087 up 1.21%
Technical Outlook:
* Bank Nifty started the session on a positive note, however the index witnessed heightened volatility, oscillating ~1900 points throughout the day. Consequently, the daily price action formed a bullish candle with long wick on lower ends, indicating supportive buying emerged from the lower levels..
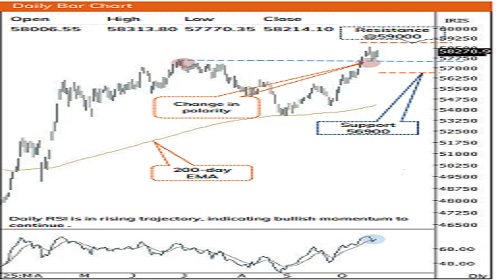
* Key point to highlight is that the index continued to maintain higher bottom formation for the third-consecutive session, while forming higher base above its previous all time high zone, indicating sustained bullish momentum and reinforcing the continuation of the primary uptrend. Meanwhile, momentum indicators such as RSI in all major timeframe is sustaining above the 60 reading, indicating strong bullish momentum. Hence, one should adopt a buy-on-dips strategy with immediate support placed near 56,900 representing the 38.2% retracement of the ongoing up move (54,226-58,577).
* Structurally, over the past two decades, there have been 17 instances where Bank Nifty, following a decisive breakout above its previous twomonth high, has delivered double-digit returns within the subsequent four months while surpassing its prior all-time high. In the current scenario, with the index decisively breaking out above its previous two-month high, a similar structural rhythm appears to be unfolding, indicating a high probability of achieving double-digit returns and surpassing the all-time high of 57,600 in the coming months.
* PSU Bank Index has relatively outperformed the benchmark and closed on a positive note. Index has surpassed and closed above its previous alltime high(8,053) after nearly 16 months, indicating a structural breakout and renewed strength within the space. Going ahead, we expect the index to resolve higher, with positive follow-through action supporting continuation of the uptrend. Therefore, any dip from current levels should be seen as a buying opportunity, with immediate support placed near 7,600, which aligns with the 38.2% retracement of the latest upswing (6,730–8,118)
Intraday Rational:
* Trend- Higher high-low formation confirms positive momentum
* Levels: After a positive opening utilize declines towards Tuesday 61.8% retracement(58090-58625)
Please refer disclaimer at https://secure.icicidirect.com/Content/StaticData/Disclaimer.html
SEBI Registration number INZ000183631