Copper Long Term Report as on 23rd Sept 2025 by Kedia Advisory

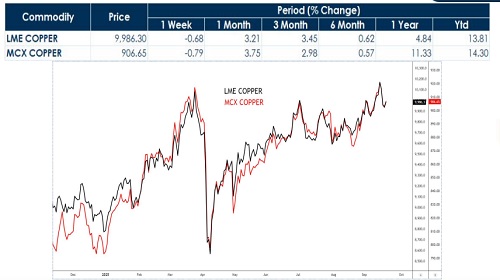
Copper Performance
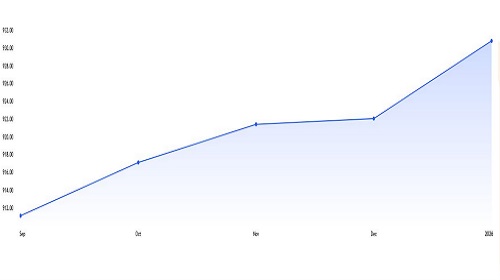
Copper Futures forward curve chart
The current Copper Futures forward curve chart shows a gradual upward slope from September through early 2026, indicating a contango market structure. This means that future contracts are priced higher than the current spot price, reflecting expectations of stronger demand or potential supply constraints ahead. Prices start near Rs.912 in September and steadily climb to around Rs.930 by early 2026, suggesting moderate bullish sentiment. The rise between November and December is flatter, implying some short-term consolidation before a sharper pickup into 2026. Such a curve typically signals carrying costs, storage factors, and positive market outlook. For traders and hedgers, this forward curve suggests that copper is expected to become more expensive in the coming months, making adding positions potentially more cost-effective for consumers while offering arbitrage or roll yield opportunities for investors.
SWOT Analysis
Strengths
* Copper gained to make a high of 921.50 tracking LME prices crossed 10180 levels after June 2024.
* Dollar index held around 96.70, hovering at 2-½-month lows
* U.S. and Chinese officials reached a framework agreement regarding short-video app TikTok, igniting hopes that a trade deal will be close.
* China’s factory activity came at 50.30 in August expanded at the quickest pace in five months on the back of rising new orders.
* Peru's copper output slid 2% to 228,007 metric tons in July compared to the same month last year.
* In July, Collahuasi, saw output drop 27.2% to 34,200 tons.
Opportunities
* China announced a 5% decline in copper production in early September, cutting about 500,000 tons of refined copper from the global market.
* Supply pressures deepened after major producer Freeport-McMoRan confirmed its Grasberg mine in Indonesia.
* Inventories remain near multi-year lows, with London Metal Exchange stockpiles about 40% below their five-year average.
* BMI increased its forecast for China's copper demand growth this year to 3.8%, versus a forecast of 2.9% at the beginning of the year.
* Goldman Sachs has raised its LME copper forecast H2 2025 to an average of 9,890 per tonne, up from a previous call of 9,140.
* BMI forecasts copper demand for electric vehicles will jump to 2.2 million tons in 2030, compared with 1.2 million tons in 2025, up from just 204,000 tons in 2020.
Weakness
* China's refined copper production in August climbed by 14.8% from the prior year to 1.3 million tons.
* Codelco's production rose to 6.4% 118,500 metric tons while Escondida, saw a 7.8% increase to 114,800 tons in July.
* Copper inventories in warehouses monitored by the Shanghai Futures Exchange rose 14.9 % from last Friday.
* Copper market in 36,000 metric tons surplus in Jun 2025 – ICSG
* Gains on metals markets were restrained by worries about US tariffs, which helped to dampen factory activity in parts of Asia.
Threats
* Chile expects copper output to expand this year despite setbacks at two major mines
* World refined copper market in 289,000 t surplus in 2025; 209,000 t surplus in 2026 – ICSG
* China's refined copper output is set to hit a record high in 2025.
* China’s economy continues to face multiple risks and challenges, citing August 2025’s weak performance amid mounting global headwinds.
* The IMF and OECD’s has downgraded global growth projections for 2025, intensifying market pressure.
* As per weekly chart, Rising Wedge Pattern is in formation.
Copper News
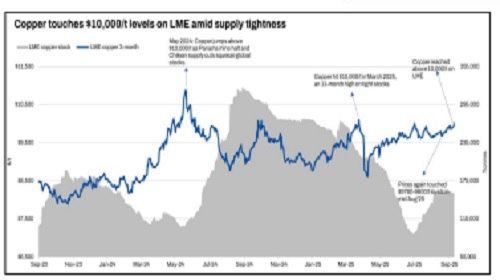
Copper Prices Buoyed by Supply Strains and Trade Optimism
Copper touched 921.50 on MCX, tracking LME highs above 10,180, its strongest since June 2024. Gains came as U.S. and China reached a framework deal on TikTok, reviving hopes for broader trade progress. Supply pressure remained evident with Peru’s July output down 2%, led by sharp drops at Collahuasi (-27.2%). Meanwhile, China’s refined copper output rose 14.8% YoY in August to 1.3 Mt, but a 5% production cut in early September cut nearly 500,000 tons from global supply. Inventories on SHFE jumped 14.9% WoW, though LME stocks remain 40% below five-year average, keeping markets tight despite growth headwinds.
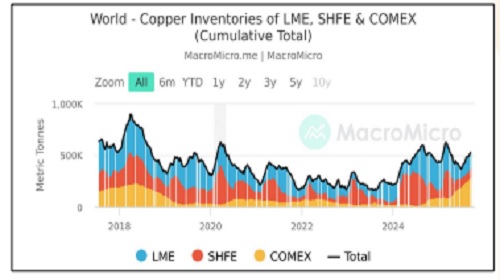
Diverging Copper Inventories Signal Uneven Market Outlook
Mid-September 2025 copper inventories show stark regional contrasts shaping price dynamics. LME stocks fell over 9,000 tonnes since September 1, underscoring persistent tightness in Europe and Asia despite elevated spot levels. In China, SHFE warehouse inventories held steady near 19,000 tonnes, but broader social stocks rose modestly, reflecting adequate physical supply and cautious procurement. By contrast, COMEX inventories surged to record highs above 312,000 short tons, up over 16% in a month, highlighting weak North American demand and heavy warehouse inflows. This divergence signals localized bullishness in Europe, balanced conditions in China, and bearish risks in the U.S., leaving copper prices highly sensitive to global arbitrage and demand recovery signals
Copper/Gold Ratio and Industrial Divergence
The Copper/Gold ratio has historically been seen as a leading indicator of economic strength, often moving in sync with industrial stocks. However, the chart highlights a striking divergence since mid-2024—industrials have continued to rally while the Copper/Gold ratio has weakened sharply. This breakdown signals that liquidity and debt-driven market speculation are overpowering real economic fundamentals. For copper prices, the decoupling suggests caution: despite bullish equity sentiment, copper’s relative weakness against gold reflects softer industrial demand, potential oversupply risks, and waning economic momentum. Until this ratio stabilizes, copper may struggle to sustain long-term gains, even if short-term rallies occur on policy or liquidity boosts.
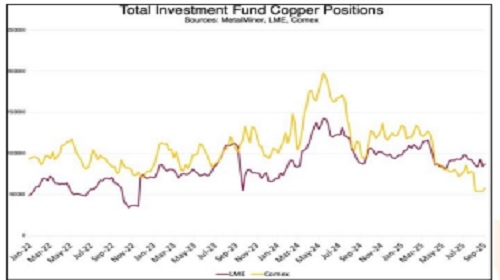
Copper Markets Rattled as Funds Exit After Tariff Shock
Copper prices have faced turbulent swings in recent months, with the Section 232 tariff exclusion dismantling Comex’s premium over LME contracts and catching investors off guard. The abrupt drop erased nearly $3,100/mt from Comex highs, forcing Goldman Sachs to retract a bullish call issued just a day earlier. Data from September 2025 shows investment funds retreating sharply, particularly on Comex, where speculative positions had carried the most upside risk. Despite copper’s addition to the USGS draft list of critical minerals, signaling long-term strategic importance, market sentiment remains fragile. With funds scaling back and policy uncertainty persisting, copper’s near-term trajectory looks vulnerable even as structural demand stays robust.
Demand Outlook Lifts Copper Despite Growth Risks
China’s factory PMI rose to 50.3 in August, expanding at the fastest pace in five months, driven by new orders and infrastructure spending. This, alongside EV and grid demand, prompted BMI to raise its 2025 copper demand growth forecast to 3.8%, up from 2.9%. However, global macro challenges loom as the IMF and OECD cut 2025 growth outlooks, tempering enthusiasm. Still, optimism persists as China is set to reach record-high refined copper output in 2025, balancing short-term supply cuts. Trade tensions and US tariff uncertainty continue to restrain rallies, but the Silver-Copper ratio reversal signals potential copper outperformance versus precious metals.
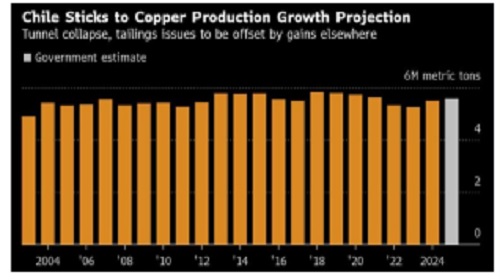
Chile Signals Copper Supply Revival Amid Global Demand Surge
Chile, the world’s largest copper producer, expects output growth in 2025 despite recent setbacks at Codelco and Teck operations. Mining Minister Aurora Williams projects production en route to a record 6 million tons by 2027, reversing the decline to a 20-year low in 2023. Stronger output from BHP’s Escondida, Collahuasi’s ore improvements, and the ramp-up of El Salvador are driving optimism. Industry consolidation, including Anglo-Teck and Codelco partnerships, could add nearly 300,000 tons, strengthening Chile’s market role. With demand accelerating from the energy transition and AI-driven data centers, higher Chilean supply may ease short-term tightness but reinforce copper’s long-term bullish trajectory, keeping prices supported on fundamentals
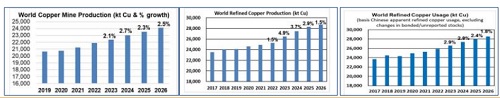
World Refined Copper Usage and Supply Forecast
HIGHLIGHTS
* World copper mine production is expected to increase by 2.3% in 2025 with growth of 2.5% forecast in 2026
* World refined copper production is forecast to rise by about 2.9% in 2025 and 1.5% in 2026
* World apparent refined copper usage is expected to increase by about 2.4% in 2025 and 1.8% in 2026
* World refined copper balance projections indicate a surplus of about 289,000 tonnes for 2025 and 209,000 tonnes for 2026
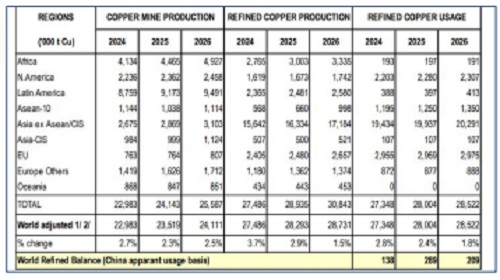
Thousand metric tonnes
1/ Based on a formula for the difference between the projected copper availability in concentrates and the projected use in primary electrolytic refined production. 2/ Allowance for supply disruptions based on average ICSG forecast deviations for previous 5 years.
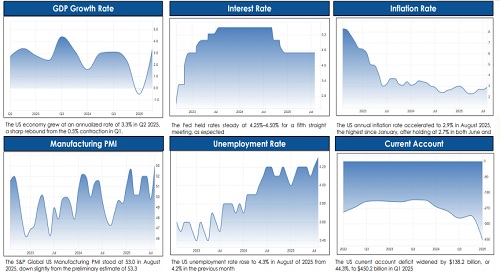
Macro Indicators - U.S.
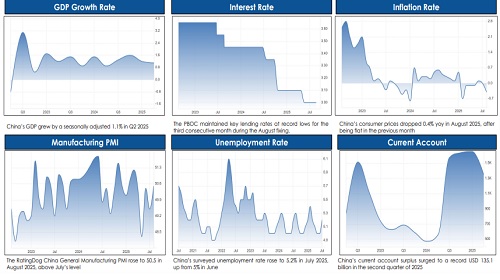
Macro Indicators - China
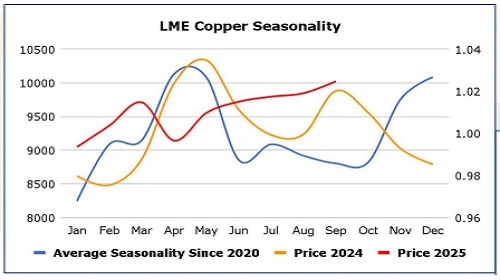
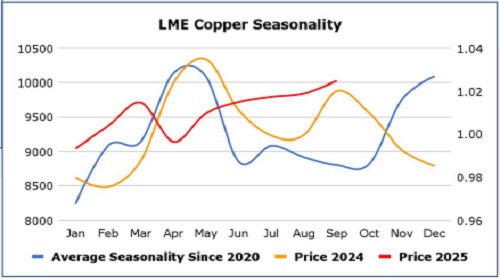
Copper Seasonality
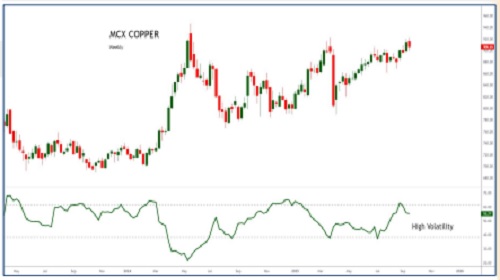
MCX Copper
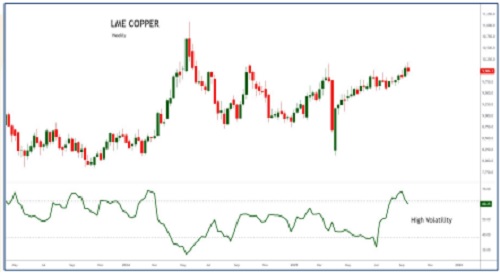
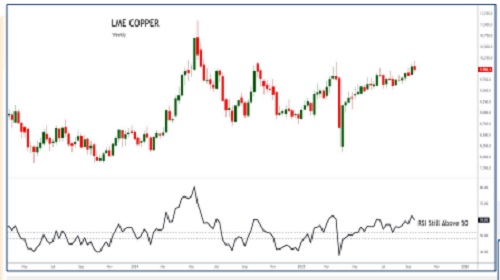
LME Copper
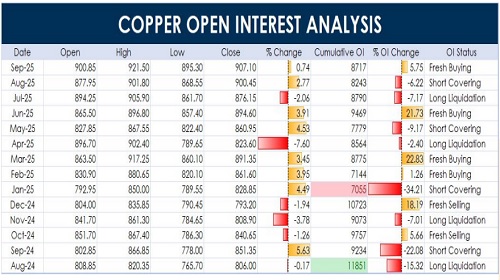
OPEN INTEREST
VOLATILITY
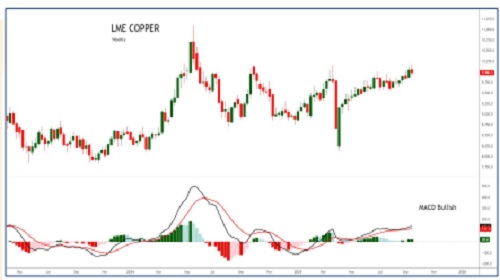
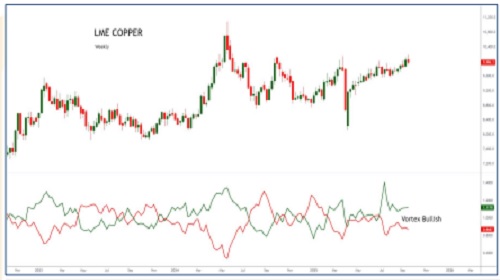
LME COPPER
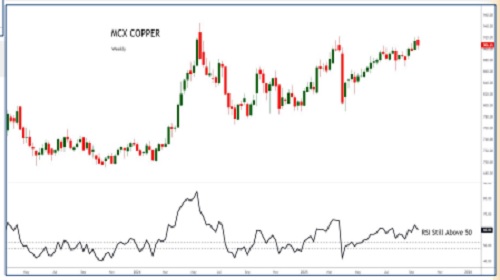
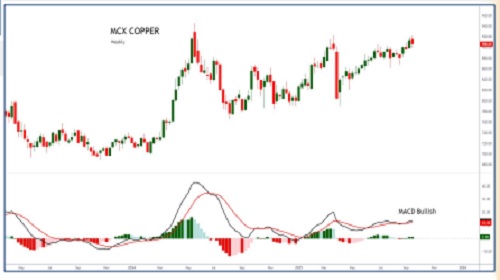
MCX COPPER
RSI
LME COPPER
MCX COPPER
MACD
LME COPPER
MCX COPPER
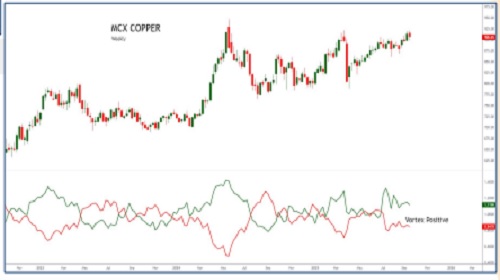
VORTEX
LME COPPER
MCX COPPER
Outlook
LME COPPER
MCX COPPER
Copper Technical - Comments
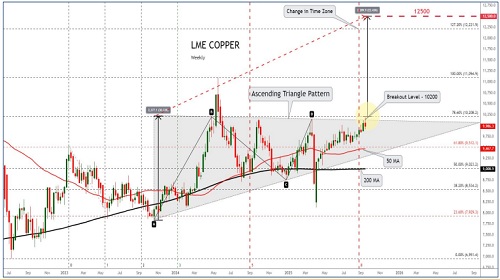
LME Copper Breaks Out from Triangle, Eyes 12500 Upside
Market Overview
Looking at the weekly chart, LME Copper has clearly broken above a long-standing ascending triangle pattern, signaling strength in the current uptrend. After consolidating for months below the 10200 resistance, prices have now breached this key level, supported by strong bullish candles. The trend is turning positive, with price action staying well above both the 50-week and 200-week moving averages, indicating long-term buying momentum.
Technical Overview
The breakout above 10200 marks a decisive move, and the weekly close above this level suggests a continuation towards the next major resistance at 12500. This breakout follows a textbook ascending triangle formation, with higher lows since late 2023. The price is holding comfortably above the 50-week moving average at 9467 and the 200-week moving average near 9028, both of which now act as strong support zones.
The Fibonacci projection from the triangle breakout suggests a target near 12500, which aligns with the 127.20% extension level at 12221. Momentum-wise, although the chart does not show RSI or MACD directly, the breakout strength and bullish candle structure imply rising momentum.
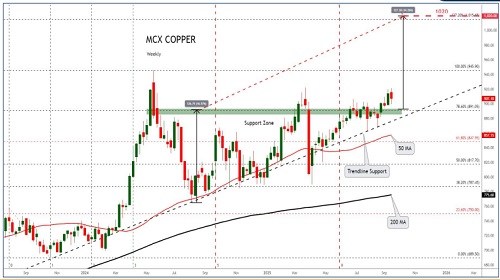
MCX Copper Breaks Above 900, Eyes Upside Towards 1020
Market Overview
Looking at the weekly chart, MCX Copper has finally pushed above its major supply zone near 900, confirming a bullish breakout after multiple attempts. The recent weekly close at 907.10 is the strongest in months, backed by steady higher lows and trendline support. Price action continues to hold above the 50-week and 200-week moving averages, which is a clear sign that the broader trend is turning more positive.
Technical Overview
MCX Copper has now broken past the key resistance zone between 890–900, which had earlier acted as a tough ceiling since May 2024. This breakout is backed by a well-respected trendline and clean support near 847.95 (61.8% Fibonacci level) and the 50-week moving average. The 200-week moving average sits comfortably lower at 775.60, offering deeper support.
The Fibonacci extension projects an upside target near 1020, aligning with the 127.20% level. Prices are showing strength without excessive volatility, and the breakout candle is solid and well-supported by prior price action. There is no volume data visible on this chart, so our focus stays on clean price structure and indicator alignment. With prices now holding above the breakout zone, the bias remains clearly bullish.
Conclusion
Price Performance: MCX copper touched 921.50, tracking LME above $10,180/t—the strongest since Jun-2024—as the dollar index hovered near 96.7 and risk sentiment improved on U.S.–China trade signals.
SWOT Analysis: Tight visible stocks (LME ~40% below 5-yr avg) and policy tailwinds vs. record Chinese refined output and ICSG’s projected 2025–26 surpluses keep copper range-positive but headline-sensitive.
Fundamentals: Peru’s July mine output fell 2% YoY (Collahuasi -27.2%) while China’s refined output +14.8% YoY in Aug to 1.3 Mt; early-Sep guidance implies a ~5% production cut (~0.5 Mt) tightening near-term availability. SHFE warehouse stocks rose 14.9% w/w, but LME inventories ~40% below their five-year average keep the market tight. BMI lifted China’s 2025 demand growth to 3.8%; IMF/OECD growth downgrades temper the macro backdrop
Inventories: Regional divergence persists—LME stocks trending lower; COMEX stocks >312k short tons (up >16% m/m) flag U.S. softness. ICSG projects refined surpluses of ~289 kt (2025) and ~209 kt (2026) despite mine growth only ~2.3–2.5% into 2026. Net: medium-term balances loosen, but visible exchange stocks still tight ex-U.S.
Technical: Price reclaimed the upper band of the recent range with daily momentum supportive (RSI/MACD improving) while the weekly “rising-wedge” risk argues for disciplined risk management. Supports: 902/888. Resistance: 930/950. Bias stays constructive above 895; a close below 888 would weaken structure.
Above views are of the author and not of the website kindly read disclaimer