Company Update : Titan Company Ltd By JM Financial Services Ltd
Standalone Performance
* Revenue: Standalone revenue grew ~18% YoY (ex- bullion), led by 19% underlying growth in jewellery (ex-bullion), 13% in watches, and 9% in eyewear. The quarter witnessed a slow start and performance progressively improved with the early festive commencement in September.
* Margins: Reported EBITDA grew 43% YoY (4% below JMFe) as EBITDA margin expanded ~120bps YoY to 9.8% (11.1% ex-bullion; JMFe: 11.5%) led by gross margin expansion of ~60bps YoY to 22.7% (ex bullion; JMFe: 21.9%) and ~20/60bps lower employee/other expense partially offset by ~10bps YoY higher advertisement expenses.
* PAT grew 43% YoY to INR 10.1bn (7% below JMFe) as other income declined 14% YoY and interest/ depreciation grew 14%/11% YoY.
Segmental Performance
Jewellery
* Jewellery underlying standalone revenue (ex-bullion) grew 19% YoY to INR 127.85 bn. The domestic business (Tanishq, Mia and Zoya combined) grew 18% YoY to INR 12.5 bn (LTL – 14%). The sharp rise in gold prices and high base effect (of Q2FY25) due to the customs duty reduction, impacted buyer growths this quarter leading to a marginal decline YoY
* The domestic business saw strong pick-up in consumer momentum in the festive period during Navratri. Tanishq's attractive gold exchange offer supported sales despite high gold prices. The overall growth was led by ticket size improvements with buyers witnessing marginal decline YoY. CaratLane's targeted coins promotion offer drove traffic and conversions helping deliver a strong growth for the quarter.
* Within the mix, gold jewellery grew ~13% YoY, coins grew ~65% YoY reflecting investment - led demand, while studded grew at a steady ~16% YoY driven by new collections and ‘Festival of Diamonds’. Studded share of domestic jewellery (incl caratlane) remained flat at 34% in Q2.
* Standalone EBIT margin (ex-bullion) contracted ~60bps YoY to 10.8% (JMFe: 11.1%). The domestic portfolio (Tanishq, Mia and Zoya combined) recorded an EBIT at INR 1.38 bn in Q2 at a margin of 11.1%. EBIT margins were under pressure on account of skewed product mix resulting from (a) higher gold coin sales (b) reduced studded margins on account of gold price jump and (c) investments in exchange offers & campaigns to drive growth
* Consolidated Jewellery revenue grew (ex-bullion) 20% YoY on 32% YoY increase in Caratlane business (LTL – 15%). International Jewellery business nearly doubled to INR 5.6 bn demonstrating strong momentum in UAE and North America. Caratlane EBIT margin expanded ~310bps YoY to 10.1% amounting to INR 1.1 bn.
* Store addition: Of the 34 (net) store additions in India, it added 6/18/10 stores under Tanishq/ Mia/ Caratlane. Tanishq added a new store in Virginia, USA,
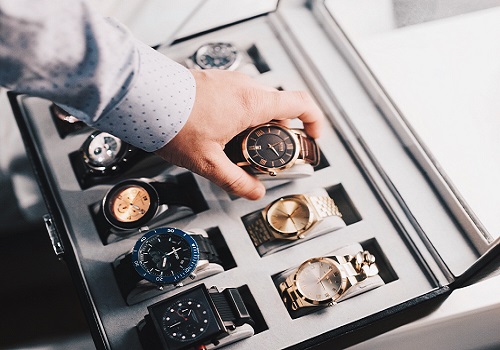
Watches
* Watches revenue grew 13% YoY, and EBIT grew 21% YoY (6% beat) as EBIT margin increased ~110 bps YoY to 16.1%. The SSSG across key retail formats were in healthy double-digits.
* The analog segment grew 17% YoY, driven by double-digit volume growth and higher ASP. The premiumization journey is steadily progressing across Titan, Fastrack and Sonata brands. Retail formats saw consistent double-digit SSSG. The healthy revenue trajectory delivered operating leverage gains for the business.
* Smart Watches segment was lower by ~22% YoY led by drop in volumes whereas average selling prices were higher YoY.
* Store addition: 5/6/3/1 stores of Titan world/ Helios/Fastrack/Helios Luxe were added in 2Q.
Please refer disclaimer at https://www.jmfl.com/disclaimer
SEBI Registration Number is INM000010361