Commodity Weekly Report 24th August 2026 by Choice Broking

Gold
COMEX gold climbed above $4,600 an ounce, its highest level since mid-May, extending weekly gains to around 5%. The rally was driven by renewed concerns over US fiscal sustainability after the Treasury expanded planned purchases of longer-dated government debt, pressuring bond yields and the dollar while strengthening gold’s appeal as an alternative store of value. Expectations of further buybacks and measures to contain elevated financing costs added support. However, rising oil prices may limit further gains by keeping inflation pressures elevated and reducing expectations for rate cuts. Intensifying US economic pressure on Iran has also reduced hopes for a quick reopening of Hormuz. Robust investment demand and continued central-bank buying, particularly from China, remain supportive, while markets will closely track upcoming Fed guidance at Jackson Hole this week
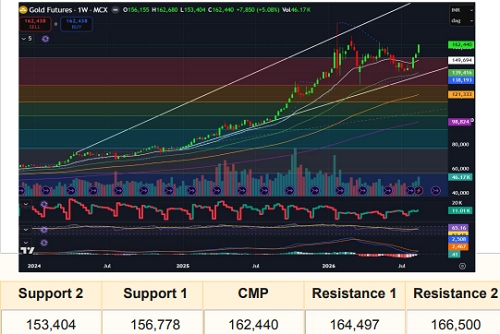
Gold price has continued to incline for the 3rd consecutive week, where price has surged by more than +5% in past week and settled at 162,440. Gold price has remained in Rising channel formation, sustaining over its key moving averages i.e. 20, 50 and 100-DEMA levels placed at 152491, 149785 and 149011 respectively. Daily SAR is also placed at 153,404. Immediate resistance would be at previous peak placed at 164,497. Along with a price-incline, we can observe a rise in OI level to 11,010 lots in current expiry, suggesting Long buildup. RSI levels remained over 65 -70 level on Daily and Weekly timeframe. On the other hand, we can observe a bullish crossover on weekly MACD alongside declining negative histograms.
The overall trend in Gold price is expected to be Sideways-to-Bullish in the coming week, and traders should keep an eye on key US economic data such as Core PCR price index, Prelim GDP and Unemployment claims along with Jackson Hole Symposium which are scheduled to be in next week
Silver
COMEX Silver prices rose above $68.20 an ounce, reaching a two-month high and extending gains for a third consecutive week, supported by strong industrial demand and renewed interest in hard assets amid concerns over currency debasement. The US Treasury’s decision to double long-term bond buybacks strengthened expectations of efforts to contain rising borrowing costs, while concerns over higher deficit spending and dollar liquidity encouraged investors to diversify into precious metals. Industrial demand remained a key support, particularly as Chinese imports of silver-bearing ores surged alongside expanding solar-panel and electricity-grid production. Meanwhile, markets will closely track Fed guidance at Jackson Hole also, prolonged Middle East tensions conflict remains unresolved despite a reduction in direct hostilities continue to underpin safe-haven demand.
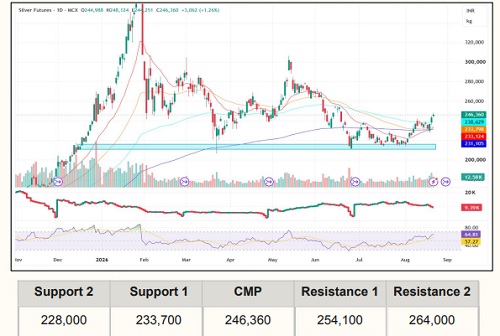
MCX Silver prices witnessed a strong recovery, surging around 4–5% over the week after finding support near 231,000, and closed the week at 246,360, sustaining well above all key moving averages. The 20-50-100-200 DEMA are placed at 238,630, 233,800, 233,125 and 231,105, respectively, while the RSI stands at 64.81, above its average of 57.27, reflecting strengthening bullish momentum without yet entering an extreme overbought zone. OI declined to 9,390 lots despite the sharp price rise, indicating short covering and supporting the ongoing recovery. Meanwhile, the Gold/Silver ratio (Mint Ratio) is around 66.7:1, and a sustained breakdown below 66–64 could further improve silver’s relative strength and provide additional support to silver prices.
Overall, the trend has shifted towards sideways to positive, with momentum improving and key technical indicators turning supportive. Traders may adopt a buy-on-dips approach while keeping the support zone under close watch for trend continuation.
Crude Oil
WTI crude oil posted a second consecutive weekly gain, as markets weighed heightened geopolitical risks and potential disruptions to Middle Eastern energy flows. Prices were supported by expectations of further US measures targeting Iran, with Washington set to announce new economic sanctions that could affect countries trading with Tehran, including China, its largest crude buyer. Beijing has opposed economic pressure and called for diplomacy. Supply concerns were also reinforced by disruptions to Russia’s energy sector, where Ukrainian attacks on refineries and ports have affected fuel production. However, continued crude flows through the Strait of Hormuz provided some relief, with US officials saying tankers have transported more than 660 million barrels through the corridor since early May.
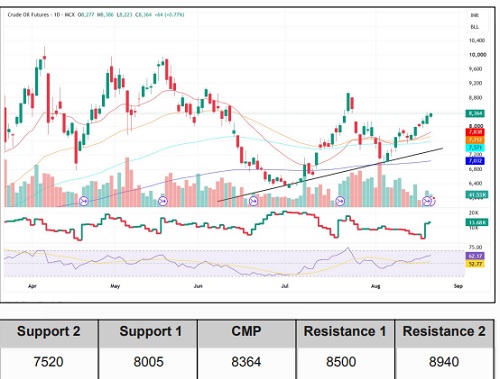
MCX Crude Oil prices continued to witness a strong bullish momentum during the week, surging around 7–8% and closing at 8,364, comfortably above all key moving averages. The 20-50-100-200 DEMA are placed at 7,838, 7,712, 7,571 and 7,032 respectively, indicating a positive trend structure with price sustaining above short- as well as long-term averages. The chart also shows a rising trendline from the recent lows, providing additional support to the ongoing upmove. RSI stands at 62.17, above its average of 52.77, reflecting strengthening momentum while still remaining below the overbought zone. OI has increased along with the price up move, reaching 13,680 lots, indicating long buildup and adding further confirmation to the bullish bias.
Overall, the trend remains moderately bullish, with traders may adopt a buy-on-dips strategy while monitoring the key near term support levels.
Natural Gas
US Natural gas prices rose to around $2.77/MMBtu, gains for a second consecutive week as hotter weather forecasts boosted expectations for power-sector demand. Above-normal temperatures through September 4 are likely to increase air-conditioning use, while Texas power demand is expected to challenge previous records. However, abundant supply continues to cap the upside, with EIA data showing a 16 Bcf storage injection, below both last year’s 19 Bcf and the five-year average of 29 Bcf. Inventories remain above seasonal norms amid record production. Meanwhile, US LNG feedgas flows averaged 17.2 Bcfd in August. Geopolitical tensions around the Strait of Hormuz are raising concerns over Gulf LNG supplies, while Europe’s storage levels remain low at 62%, increasing winter supply risks despite the European Commission’s reassurance.
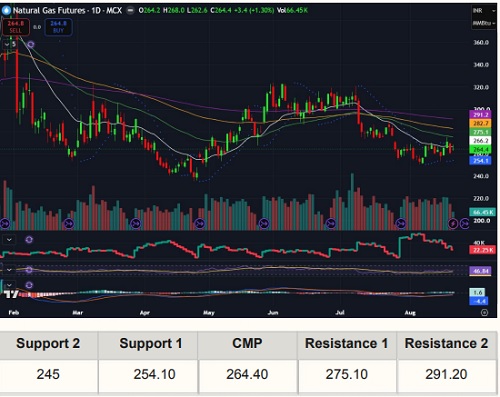
Natural gas price has been traded back & forth over the course of the week, managed to settle on a positive note in past week at 264.40. On Weekly timeframe, we can observe a Bullish Spinning top formation suggesting indecision among traders. Looking at past couple of weeks momentum, priice has remained into range of 253 - 268. Price has remained below all its key moving averages i.e 50, 100 and 200-DEMA levels placed at 275.10, 282.70 and 291.20 respectively. Daily SAR is placed at 254.10. Along with price consolidation at bottom, we can observe a decline in OI level to 22,250 lots. The momentum indicator, RSI remained below 50 on Daily as well as Weekly chart.
Looking ahead to the expiry in this week, we are expecting range-bound momentum in Natural gas in between 255 - 270.
Copper
LME copper futures ended the week higher as tight physical supply and strong structural demand continued to support prices. Demand expectations are being strengthened by rapid expansion in AI data centers, power grids and defense infrastructure, where copper remains essential for electricity generation, transmission and distribution. Supply concerns persist after months of inventory outflows and metal diversions toward the US ahead of potential tariffs. Chile, a leading producer, also expects lower copper output this year as mine disruptions and development challenges weigh on production. However, increased deliveries into LME warehouses have provided some relief from the recent supply squeeze. Meanwhile, a weaker US dollar boosted copper’s appeal, while investors monitored geopolitical tensions and potential US sanctions on Iran, which could raise energy costs and reinforce broader inflationary pressures.
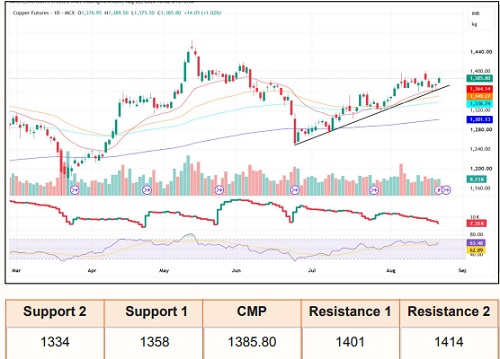
MCX Copper prices continued to maintain a sideways-to-bullish momentum, with the week closing at 1,385.80, comfortably above all key moving averages. The 20-50-100-200 DEMA are placed at 1,364.14, 1,349.30, 1,336.74 and 1,301.13 respectively, indicating a positive price structure and sustained buying interest above the key averages. The chart also shows a rising trendline from the recent lows, providing dynamic support to the ongoing up move. RSI stands at 63.48, above its average of 62.89, reflecting positive momentum and strengthening buying interest, while remaining below the overbought zone.
Overall, the technical setup remains sideways to bullish, with prices sustaining above the short- and long-term DEMA levels. Traders should closely monitor price action around the immediate resistance zone and consider a buy-on-dips strategy
Aluminium
LME Aluminium futures remained broadly steady through the week as rising Chinese supply offset disruptions linked to the Middle East conflict. China’s aluminium exports surged 18.7% year-on-year through July, with muted domestic demand encouraging producers to increase overseas shipments despite Beijing’s 45 million-tonne output cap. Higher Chinese exports helped ease concerns over supply shortages stemming from the Middle East. However, the alumina and aluminium supply chain continued to face disruptions. Brazil’s Alunorte, the world’s largest alumina refinery outside China, reduced operations to half capacity after natural-gas shortages. Norsk Hydro also faced production and sales disruptions following gas-related shutdowns at its Qatalum joint venture in Qatar. LNG shortages in the Middle East, caused by tanker blockades and geopolitical tensions, remain a key risk for aluminium refining and could tighten regional supply further.
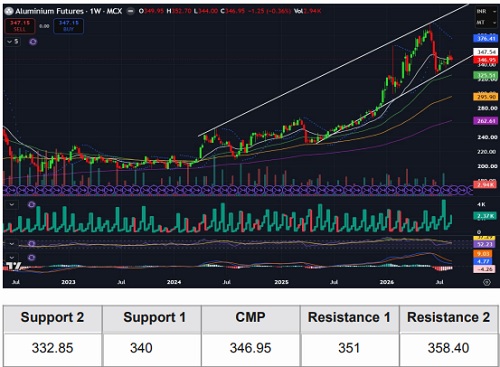
MCX Aluminium September contract has resumed with slightly gapped up at 349.95 , made a high at 352.70 on Monday, however unable to sustain over this level and closed on a negative note at 346.95. Price has continued to trade in Rising channel formation, trading in-between 50 and 200-DEMA levels placed at 348.60 and 332.85 respectively. Daily SAR is placed at 358.40. Along with past week’s decline, we can observe a rise in OI level to 2370 lots, suggestiing short builup. RSI level has dropped below 50 level on Daily timeframe. Also, on Daily MACD, we can find a bearish crossover above Zero-line along side negative histograms.
We are expecting Sideways-to-Bearish trend in Aluminium towards expiry and traders should look for Sell-on-rise strategy in this week.
For Detailed Report With Disclaimer Visit. https://choicebroking.in/disclaimer
SEBI Registration no.: INZ 000160131