Commodity Evening Snapshot 28 Apr 2026-Axis Securities Ltd

What’s Driving Prices
Macro
* Gold prices slipped below $4,700 per troy ounce as rising energy costs intensified inflation concerns and strengthened expectations of a prolonged higher interest-rate environment. Market sentiment also weakened after President Donald Trump and his national security team expressed scepticism over Iran’s latest proposal.
* WTI crude futures climbed to around $98 per barrel, reaching a two-week high as stalled efforts to resolve the US–Iran conflict and reopen the Strait of Hormuz kept markets on edge.
* European natural gas futures eased toward €44 per MWh, pulling back from a two-week high as investors assessed ongoing diplomatic developments related to the reopening of the Strait of Hormuz.

Reading the Charts
Panel One
* 15-minute candlesticks for a rolling three-day period have been plotted.
* Blue horizontal line shows an open gap which could either be up or down (open-gap up: low of next candle does not overlap the high of the prior candle, and vice versa for an open-gap down). The horizontal line showing the gap will only appear if the price has not visited the gap area.
Panel Two
* Plots the Slow Stochastics study to identify overbought (90 and above) and oversold (20 and below) areas.
* Signals are generated when the fast line (black) crosses the slow line (blue)
Panel Three
* Plots the Fisher Transform study that helps identify extremes and makes turning points clearer.
* Red bands lie between +2 and +3 and can be thought of as an area where a peak could occur. Green bands lie between -2 and -3 and often mark bottoms.
Gold 1,50,200 | Silver 2,42,850
SELL GOLD BELOW 150000 SL ABOVE 151500 TGT 148000/146000
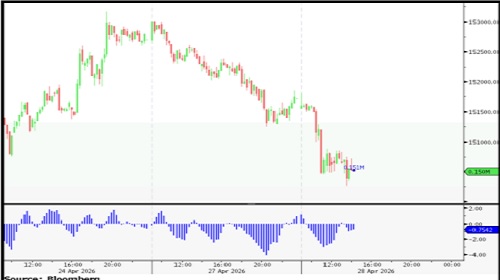
* Nearby Support: 1,50,000/ 1,47,500/ 1,45,500
* Nearby Resistance: 1,52,000/ 1,54,500/ 1,57,000
* Nearby Gaps: 1,51,000.
SELL SILVER BELOW 241000 SL ABOVE 247000 TGT 235000/230000
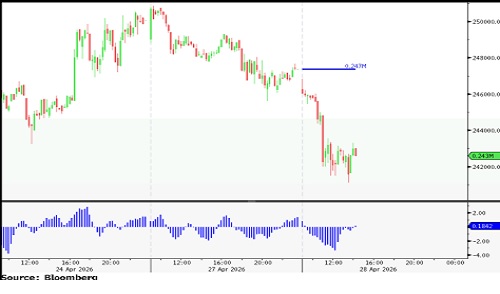
* Nearby Support: 2,41,000/ 2,36,000/ 2,30,000
* Nearby Resistance: 2,47,000/ 2,54,000/ 2,59,000
* Nearby Gaps: 2,47,000.
Crude 9,377 | Copper 1,285.50
BUY CRUDEOIL ABOVE 9450 SL BELOW 9250 TGT 9700/9900
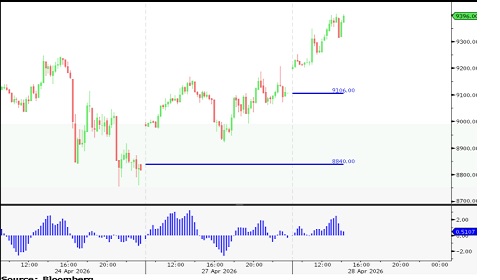
* Nearby Support: 9,150/ 8,900/ 8,700
* Nearby Resistance: 9,450/ 9,700/ 10,000
* Nearby Gap(s): 9,106.
SELL COPPER BELOW 1283 SL ABOVE 1290 TGT 1273/1265
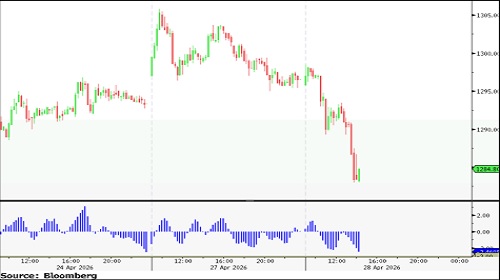
* Nearby Support: 1,283/ 1,274/ 1,267
* Nearby Resistance: 1,299/ 1,308/ 1,315
* Open Gap(s): NONE.
For More Axis Securities Disclaimer https://simplehai.axisdirect.in/disclaimer-home
SEBI Registration number is INZ000161633