Buy Cholamandalam Inv. & Finance Ltd for the Target Rs. 1,900 by Motilal Oswal Financial Services Ltd
Healthy performance; asset quality improves significantly
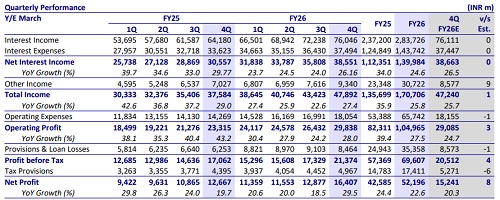
Business AUM rises ~21% YoY; NIM (calc.) expands ~10bp QoQ
* Cholamandalam Inv. & Finance’s (CIFC) 4QFY26 PAT grew ~30% YoY to INR16.4b (~8% beat). FY26 PAT grew ~23% YoY to INR52.2b. NII in 4QFY26 grew ~26% YoY to ~INR38.6b (in line). Other income grew ~33% YoY to~INR9.3b. This growth was mainly driven by higher fee income of INR6.3b (PY: INR4.6b) and higher assignment income of ~INR1.1b (PY: INR940m).
* Opex rose ~27% YoY to ~INR18b (in line), and the cost-to-income ratio declined ~140bp QoQ to ~37.7% (PQ: 39% and PY: 38%). PPoP grew ~28% YoY to INR29.8b (in line). FY26 PPOP grew ~28% YoY to INR105b.
* Yields (calc.) declined ~10bp QoQ to ~14.4%, while CoF (calc.) declined ~20bp QoQ to ~7.35%. NIM (calc.) rose ~10bp QoQ to ~7.1%. While yields are expected to improve with the scale-up of gold loans, consumer durable (CD), and unsecured CSEL, the company expects NIM + fees to remain broadly stable at ~8%, as the benefit from higher yields is likely to be offset by a modest increase in CoF in FY27. We expect NIM + fees to expand to ~7.7%/7.9% in FY27/FY28 (compared to ~7.6% in FY26).
* CIFC indicated that demand remains healthy across segments, particularly in vehicle finance, with momentum sustaining into Apr’26. Management highlighted that while growth last year was driven by only three segments (HL, LAP, and SBPL), it now expects all eight divisions to contribute, supporting AUM growth of ~20-23% in FY27. We model an AUM growth of ~21% each in FY27/FY28.
* Management highlighted that early delinquency indicators and non-starters have improved significantly in Apr’26 compared to Apr’25 and Apr’24, indicating better credit quality at the origination level. The CSEL portfolio is also showing improvement, while vehicle finance NCLs are stabilizing, leading the company to guide for a decline in credit costs to ~1.5% in FY27 from ~1.6% (pre-overlay) in FY26. We estimate credit costs (as a % of avg. assets) of ~1.5%/1.4% in FY26/FY27.
* We keep our FY27E/28E EPS estimates broadly unchanged. We model a CAGR of 20%/21%/25% in disbursement/AUM/PAT over FY26-28E. We estimate an RoA/RoE of ~2.6%/20% in FY28. Reiterate our BUY rating with a TP of INR1,900 (premised on 3.6x Mar’28E BVPS).
AUM up 21% YoY; sustained momentum in disbursement growth
* Business AUM grew 21% YoY/6.5% QoQ to INR2.24t, with newer businesses now forming ~13% of the AUM mix.
* Total disbursements grew ~25% YoY and ~10% QoQ to ~INR329b. Newer lines of businesses contributed ~21% to the disbursement mix (PQ: ~20% and PY: ~17%). VF disbursements grew ~25% YoY.
* Gold loan disbursements in 4QFY26 stood at ~INR11.3b across 120 branches concentrated in Southern and Eastern India.
Stage 2 improves 40bp QoQ; credit costs decline sequentially
* GS3/NS3 improved 30bp QoQ each to 3.05%/1.6%, while PCR on S3 rose ~4pp QoQ to ~47.3%. ECL/EAD declined ~5bp QoQ to 1.97% (PQ: ~2.02%). GS3 in new businesses declined ~35bp QoQ to ~2.4% (PQ: 2.75% and PY: 2.2%).
* VF GS3 declined to ~3.8% (PQ: 4.2%), SME GS3 dipped to 3.2% (PQ: 3.25%), SBPL GS3 declined to 3.5% (PQ: 4.7%), and CSEL GS3 declined to 1.9% (PQ: 2.2%).
* Stage 2 + Stage 3 [30+ dpd] dipped ~70bp QoQ to ~5.5%. In 4QFY26, write-offs were ~INR6.9b, translating into ~1.5% of TTM AUM (PY: ~1.35% and PQ: ~1.65%). Net slippage declined to ~INR4.4b, amounting to 0.9% (PY: 1.35% and PQ: 2.35%).
* CIFC’s credit costs in 4QFY26 stood at ~INR8.5b (in line). This translated into annualized credit costs of 155bp (PY: 140bp and PQ: 180bp).
* CRAR stood at ~19.2% (Tier 1: ~14.7%) as of Mar'26.
Key highlights from the management commentary
* The home loan segment saw temporary moderation in disbursements due to operational issues such as election-related administrative delays, land record digitization mismatches, and documentation challenges (especially in the South). Management expects 1QFY27 to be better, supported by branch maturity and pan-India expansion.
* The gold loan business is being aggressively expanded, with branch count expected to increase from ~120 currently to ~480 (i.e., 360 additions), with these being exclusive branches.
* Management indicated that internal accruals should be adequate to support growth, provided AUM growth remains below ~25% and pre-tax RoTA is sustained at ~3.5%. However, if the Tier 1 capital ratio declines toward ~13%, the company may evaluate raising fresh equity capital.
Valuation and View
* CIFC delivered a strong operating performance, with healthy disbursement momentum driving ~21% YoY AUM growth. Asset quality improved significantly, supported by lower slippages and improvement across both Stage 2 and Stage 3 assets, leading to a sequential decline in credit costs, while margins expanded by ~10bp QoQ, primarily driven by a reduction in cost of funds.
* The stock trades at 3.8x FY27E P/BV. We estimate a CAGR of ~21%/25% in AUM/PAT over FY26-28 for RoA/RoE of 2.6%/20% in FY28E. Reiterate our BUY rating with a TP of INR1,900 (premised on 3.6x Mar’28E BVPS).
* Key risks: 1) weak macros translating into weaker vehicle demand and sustained lower capacity utilization; and 2) impact on asset quality and credit costs due to the ongoing West Asia crisis and the El Niño impact.
For More Research Reports : Click Here
For More Motilal Oswal Securities Ltd Disclaimer
http://www.motilaloswal.com/MOSLdisclaimer/disclaimer.html
SEBI Registration number is INH000000412