
Buy Avenue Supermarts Ltd for the Target Rs.5,200 by Motilal Oswal Financial Services Ltd

Margins likely bottomed out; growth accelerates
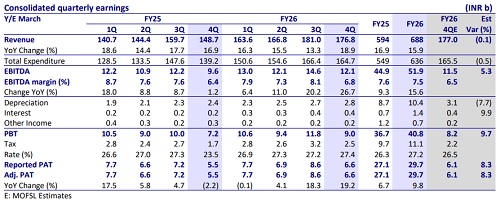
*Avenue Supermarts (DMART) delivered a strong beat on profitability in 4QFY26, driven by gross margin (GM) expansion and operating leverage.
* DMart accelerated store additions, adding 58 stores in 4QFY26 (85 in FY26) to reach 500 stores. We expect the pace of store additions to remain intact.
* With acceleration in store additions (albeit back-ended) and recovery in LFL growth (10.8% vs. ~6.8% in 3Q), revenue growth accelerated to 19% YoY.
* GM expanded 30bp YoY to 13.8% (~20bp beat) in 4Q, driven by a favorable category mix (20bp YoY increase in share of higher-margin GM&A category).
* EBITDA rose ~26% YoY (~5% beat), driven by stronger GM and operating leverage (~1% YoY growth in cost of retailing (CoR) per sqft) as margin expanded ~35bp YoY to 7.2% (~35bp beat).
* For FY26, DMart’s revenue/EBITDA/PAT grew 16%/16%/10% YoY, driven by ~20% YoY area additions, 8.1% LFL growth and steady EBITDA margins.
* FY26 OCF rose ~40% YoY (vs. ~15% YoY growth in pre-IND AS EBITDA), while capex increased ~20% YoY (in line with area additions), leading to FCF outflow of INR5.8b (vs. INR9.1b YoY).
* Our FY27-28E EBITDA is broadly unchanged; however, we raise our FY27-28E PAT by ~3-7% driven by a lower-than-expected increase in finance costs/ depreciation. We build in a CAGR of 19%/20%/19% in DMART’s consol. revenue/EBITDA/PAT over FY26-28E, driven by 16% CAGR in area additions and high-single-digit LFL growth.
* We assign a ~45x FY28E EV/EBITDA multiple (implying ~81x FY28E P/E) to arrive at our revised TP of INR5,200. We reiterate BUY on DMART.
5%/9% beat on EBITDA/PAT driven by higher gross margin
Standalone 4Q revenue grew ~19% YoY to INR172b (already disclosed), driven by ~20% area additions and 10.8% like-for-like growth (vs. 6.8% in 3Q and 8.1% YoY).
* Management noted some spikes in consumer buying during Mar’26 due to geopolitical tensions, which normalized toward end-Mar’26.
* The company added 58 stores/2.3m sqft area to reach to 500 stores/20.6m sqft area. This implies addition of an average of 39.7k sqft stores in 4QFY26 (which is slightly lower than average store size of 41.2k sqft).
* DMart’s store count was up ~21% YoY, while annualized revenue per store inched up ~1% YoY to INR1.46b and annualized revenue/sqft grew ~2% YoY to INR35.4k.
* Standalone gross profit stood at INR23.7b (up ~22% YoY, our est. INR23.3b) as gross margin (GM) expanded 30bp YoY to 13.8% (~20bp beat).
* Share of higher-margin GM&A category rose ~20bp YoY to 20.3%, while non-food FMCG share contracted ~25bp YoY to 19.8% and Foods share was up ~7bp YoY at 60%.
* Standalone EBITDA at INR12.3b (~5% beat) rose ~26% YoY, as margins expanded ~35bp YoY (-125bp QoQ) to 7.2% (~35bp beat) due to better GM and modest ~1% YoY increase in CoR per sqft.
* Driven by strong store openings, employee costs surged ~36% YoY.
* Growth in other expenses was contained at ~12% YoY (despite ~20% YoY store additions), driving operating leverage.
* Standalone PAT at INR7.2b (9% beat) rose ~17% YoY, with PAT margin moderating ~5bp YoY (-105bp QoQ) to 4.2% as interest cost (+2.36x) surged and other income (-22%) declined.
FY26 OCF up ~40% YoY; borrowings increase to fund store additions
* For FY26, DMart’s revenue grew 16% YoY to INR670b, driven by ~20% YoY store additions and 8.1% LFL growth (vs. 8.4% YoY)
* Gross profit rose ~17% YoY to INR95.8b as GM expanded ~15bp YoY to 14.3%, despite GM&A share remaining broadly stable YoY at 22.3%.
* Reported EBITDA grew ~16% YoY to INR52.6b as EBITDA margin remained steady YoY at ~7.85%.
* Pre-IND AS 116 EBITDA grew ~15% YoY to INR50b, with pre-IND AS EBITDA margin contracting ~5bp YoY to 7.47%.
* Reported PAT was up ~10% YoY at INR32.2b as finance cost surged 2.25x YoY and other income declined 26% YoY.
* DMART’s FY26 OCF (after interest and leases) rose ~40% YoY to INR33.4b, driven by EBITDA growth and favorable WC movement.
* Cash capex grew ~20% YoY (in line with area additions), leading to FCF outflow of INR5.8b (vs. INR9.1b outflow in FY25).
* DMART’s net debt, excluding leases, stood at INR7b (vs. INR3.3b net cash as of Mar’25). DMart’s lease liabilities and RoU assets increased by ~INR6b YoY.
Losses reduce YoY in subsidiaries
* Consolidated revenue grew 19% YoY to INR176.8b (in line).
* Consol. GP grew 22% YoY to INR25.7b (vs. our est. INR25.2b) as margins expanded ~40bp YoY to 14.6% (~30bp beat).
* Consol. EBITDA rose ~27% YoY to INR12.1b (5% beat) as margins expanded ~40bp YoY to 6.8% (~35bp beat), driven by stronger standalone performance and lower operating loss margin in subsidiaries at 4.3% (vs. -6.4% YoY).
* Consol. PAT grew 19% YoY to INR6.6b (8% beat). PAT margin was stable YoY at 3.7% as finance cost surged (+2.15x YoY) and other income declined (-28% YoY).
Growth improves in Food and GM&A; DMart Ready consolidates in North
* Foods, the largest contributor to DMart’s revenue, saw slight improvement in growth to ~19% YoY in 4Q (vs. ~15% YoY in 3Q), while General Merchandise and apparel (GM&A) grew ~20% YoY (vs. 15% YoY in 3Q). Non-food FMCG remained the weakest segment with ~17.5% YoY growth (vs. ~14% YoY in 3Q).
* share of GM&A in DMart’s mix improved ~18bp YoY to 20.3% in 4QFY26, while Foods’ contribution increased ~7bp YoY to ~60% in 4Q. Non-food FMCG segment’s contribution moderated further ~25bp YoY to 19.8% in 4Q.
* For FY26, Foods category grew 16% YoY, with its share increasing 17bp YoY to 57.9%, while Non-Food FMCG grew 15% YoY (contribution down 19bp YoY to 19.8%) and GM&A grew 16% YoY, with its contribution stable YoY at 22.3%.
* Bill cuts and ABV: Total bill cuts for 4Q at 101m rose ~14% YoY (up ~12.7% YoY to 398m in FY26), while 4Q average basket value (ABV) grew ~5% YoY to INR1,703 (up ~3% YoY to INR1,683 in FY26).
* DMart Ready: DMart Ready continues to focus on key metro towns. It has further rationalized its delivery channels, with renewed focus on home delivery as the preferred channel. DMart Ready discontinued its operations in Gurgaon and now operates in 18 cities (vs. 25 cities in FY25), with operations ceased in North Indian cities such as Chandigarh, Amritsar, Gurgaon, and Ghaziabad, along with Anand and Belgavi.
Valuation and view
* DMart’s store additions ramped up to 85 in FY26. Sustained acceleration in store additions remains the key growth trigger for DMart, in our view. We build in 85/90 store additions in FY27/FY28.
* While the competitive intensity from quick commerce could remain high in the near-to-medium term, we believe DMART’s value-focused model and superior store economics would ensure its competitiveness and customer relevance over the long run, especially in tier 2+ towns.
* Our FY27-28E EBITDA is broadly unchanged; however, we raise our FY27-28E PAT by ~3-7%, driven by a lower-than-expected increase in finance costs/depreciation. We build in a CAGR of 19%/20%/19% in DMART’s consol. revenue/EBITDA/PAT over FY26-28E, driven by 16% CAGR in area additions and high-single-digit LFL growth.
* We assign a ~45x FY28 EV/EBITDA multiple (implying ~81x FY28 P/E) to arrive at our revised TP of INR5,200 (earlier INR5,000). We reiterate BUY on DMART.
For More Research Reports : Click Here
For More Motilal Oswal Securities Ltd Disclaimer
http://www.motilaloswal.com/MOSLdisclaimer/disclaimer.html
SEBI Registration number is INH00000041





.jpg)