Bulls and Bears : Pain continues; the second steepest MoM dip since Oct'24 by Motilal Oswal Financial Services Ltd
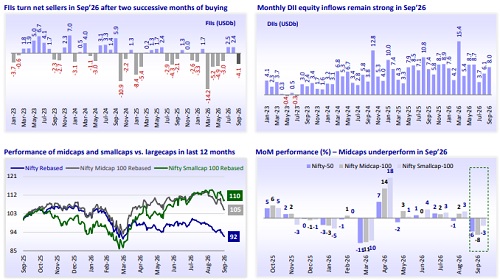
* Market slumps for the second consecutive month: The Nifty slid 6.1% MoM in Sep’26, the second consecutive month of decline amid geopolitical headwinds. The index oscillated 1,574 points before closing 1,460 points (or 6.1% MoM) lower at 22,620, the second steepest MoM dip since Oct’24. The Nifty is down 13.4% in CY26YTD. Over the last 12 months, largecaps have fallen 8%, underperforming midcaps (+5% YoY) and smallcaps (+10% YoY). Over the last five years, midcaps (CAGR: 14.3%) have notably outperformed largecaps (CAGR: 5.1%) by 67%, while smallcaps (CAGR: 12.1%) have markedly outperformed largecaps by 49%.
* FIIs record outflows after two months of inflows; DII inflows remain strong: In Sep’26, FIIs recorded outflows of USD4.1b after two consecutive months of inflows. FII equity outflows stand at USD28.3b in CY26YTD. DII inflows remained strong in Sep’26 at USD8b, taking DII equity inflows to USD67.8b in CY26YTD.
* Breadth adverse in Sep’26: All major sectors ended lower. Technology (-11%), Financials Ex Banks (-9%), Automobiles (-9%), PSU Banks (-7%), and Capital Goods (-6%) were the top laggards MoM. The market breadth was adverse in Sep’26, with 45 Nifty stocks closing lower. Adani Ports (+13%), Dr Reddy's (+7%), Coal India (+6%), ITC (+3%), and Adani Enterp. (+2%) were the only gainers, while TCS (-15%), Bajaj Finserv (-14%), Nestle (-12%), Infosys (-12%), and Maruti (-12%) were the key laggards.
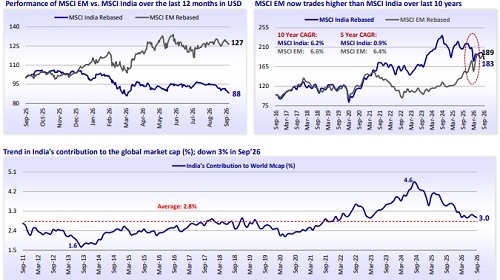
* Major global markets end lower in Sep’26: Among the key global markets, Brazil (+5%), Taiwan (+4%), Japan (+1%), and Korea (+0.3%) ended higher MoM. However, Indonesia (-7%), India (-6%), Germany (-4%), China (-4%), the UK (-2%), MSCI EM (-1%), and the US (-0.5%) ended lower MoM in Sep’26. During the last 12 months, the MSCI India Index (-12%) has underperformed the MSCI EM Index (+27%) in USD terms. Over the last 10 years, the MSCI EM Index (CAGR: 6.6%) now trades higher than the MSCI India Index (CAGR: 6.2%). In P/E terms, the MSCI India Index is trading at a 35% premium to the MSCI EM Index, below its historical average premium of 72%.
* Geopolitical headwinds overshadow underlying strength: After touching an all-time high in Sep’24, the Indian equity market has undergone a prolonged phase of consolidation, marked by both time and price correction. Persistent global, geopolitical and macroeconomic headwinds have heightened volatility across global and Indian markets, dragging down the Nifty-50 by 14% from its 2024 peak, while midcaps and smallcaps remain nearly flat. Despite the broader market staying range-bound, we examine the key factors shaping market performance and the opportunities emerging amid persistent global headwinds
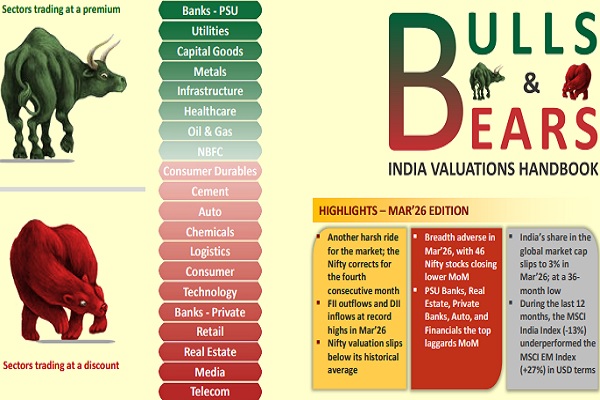
* Valuation and view: The Nifty is trading at a 12-month forward P/E ratio of 17.2x, below its LPA of 20.9x (at 18% discount). Further, its P/B of 2.5x represents a 12% discount to its historical average of 2.9x. The 12-month trailing P/E for the Nifty, at 19.8x, is below its LPA of 23.2x (at 15% discount). At 2.8x, the 12-month trailing P/B ratio for the Nifty is below its historical average of 3.2x (at 11% discount). Notably, more than half of the sectors trade at a discount to their historical averages. Healthcare, PSU Banks, Capital Goods, Utilities, Metals, Capital Markets, Defense, Logistics, and Infrastructure trade at a premium to their LPA valuations, while Oil & Gas, Consumer, Private Banks, Technology, Real Estate, Retail, Telecom, NBFCs, Consumer Durables, Chemicals, and Cement trade at a discount to their LPA. With the valuations now significantly below their peaks, earnings growth remaining healthy and macro environment staying strong, we believe risk-reward has enhanced further for Indian equities. However, given the relatively higher earnings growth in the midcap and smallcap segments, market performance is likely to remain firmly bottom-up
* Top Nifty-50 Ideas: Bharti Airtel, ICICI Bank, SBI, Titan Company, Adani Enterprises, M&M, Eternal, Bharat Electronics, Hindalco, Interglobe Aviation, Shriram Finance, BSE, and Apollo Hospitals. Top non-Nifty-50 Ideas: TVS Motor, Lenskart Solutions, GE Vernova T&D, SBI Funds Management, Indian Hotels, Meesho, Dixon Tech, Coforge, Radico Khaitan, Physicswallah, Kirloskar Oil Engines, Inventurus Knowledge Solutions, RBL Bank, and Gabriel.
FIIs record outflows after two successive months of inflows in Sep’26
MSCI India underperforms MSCI EM
NBFCs: Valuation turns reasonable across all sub segments
NBFCs trade at a P/B of 1.8x, in line with its long-term historical range of 1.8x. Following the recent correction in NBFC stocks, valuations have become more reasonable, with the earlier premium to historical multiples largely normalized. The correction has been driven by a combination of factors, including weak and uneven monsoons, heightened geopolitical uncertainty, and regulatory overhangs such as the proposed changes to IRDAI insurance commissions and the RBI’s proposed restrictions on flexi/revolving credit facilities. While these factors could weigh on near-term earnings expectations, current valuations appear to have largely factored in the recent concerns and are now aligned with long-term historical levels.
HFCs trade at ~1x, below the 10-year average of ~1.4x. Our composite HFC index includes large HFCs, such as LICHF, PNBHF, CANF, Aavas and Homefirst. Valuations have moderated amid concerns over limited margin expansion, slower loan growth and intense competition in both prime and affordable mortgage segments. The recent correction in HFC stocks has further brought valuations below historical levels, despite broadly stable asset quality.
Valuations of vehicle financiers (2.1x P/B) have expanded meaningfully over the past year, supported by a sector-wide re-rating. GST cuts have driven strong demand and disbursement momentum, which has translated into improved AUM growth for VFs. Further, resilient asset quality despite a weak macro environment has also supported the re-rating in valuations over the past year.
* Gold lenders’ valuations have moderated over the past 12 months, despite strong gold loan growth supported by rising gold prices. Intense competition and concerns around sustainability of growth have kept valuations subdued, with the segment now trading at more reasonable levels relative to its historical range.
* Valuations for NBFC-MFIs (except CREDAG) have recovered modestly from their lows but remain well below pre-crisis levels. While elevated credit costs and broad-based credit rationing had led to a sharp de-rating over the past 12-15 months, improving collection efficiency and stabilizing forward flows should support a gradual recovery in investor confidence.
For More Research Reports : Click Here
For More Motilal Oswal Securities Ltd Disclaimer
http://www.motilaloswal.com/MOSLdisclaimer/disclaimer.html
SEBI Registration number is INH000000412