Bear Candle Signals Continued Corrective Bias - ICICI Direct Ltd

Nifty : 24155
Technical Outlook
Day that was ..
The rise in crude oil prices amid escalated geopolitical tension weighed on the market sentiment. As s result, Nifty extended losses over sixth session in a row to settle at 24155, down 133 points. Market breadth tuned in favour of declines with A/D ratio of 1.2:1. Sectorally, Auto, Healthcare defied the benchmark move while IT, realty, PSU Banks extended a breather.
Technical Outlook :
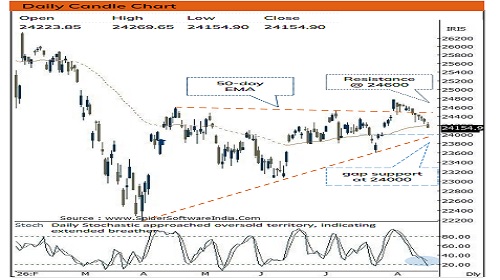
• The daily price action resulted into a bear candle carrying lower high-low as intraday pullbacks were short lived, indicating continuation of corrective bias.
• The lack of follow strength above previous session high persisted over 11th session in a row, indicating extended correction amid lack of clarity on geopolitical front.
• Structurally, breakout from contracting range result into durable move in the direction of breakout. Key point to highlight during current decline is that, index has failed to sustain above previous session high over past 11 sessions that hauled Nifty in oversold territory. Similar pattern was seen during Sept-25 & Jun-26. In both cases, index staged a 5-6% rally after closing above previous session high in subsequent weeks. Therefore, a decisive close above previous session high would be the prerequisite to confirm the pause in corrective bias and open the door for to head back towards 24600 in coming weeks.
• Another observation is that, in current 11 days corrective phase index has merely retraced 50% of preceding 7 sessions 1150 points rally. This slower pace of retracement signifies prolongation of healthy consolidation (24600-23600). Hence, any corrective dips should be viewed as an accumulation opportunity in a stock backed by strong earnings wherein immediate support is placed at 24000 being placement of three months rising trend line that coincided with gap area seen during 29th July (24040-24136).
• The Midcap index has been showing resilience by sustaining well above its 20 days EMA while trading in the vicinity of All Time High. This outperformance is further validated by significant improvement in the broader market as currently 55% of stocks of Nifty 500 universe are trading above 200 days SMA compared to three weeks back reading of 48% that bodes well for durability of buoyancy in the broader market
Intraday Rational :
• Trend – over the past seven sessions, the index has retraced merely 50% retracement level of preceding seven session ~1150- point upmove, indicating slower pace of retracement.
• Levels – Buy around 28th July gap-area (24050-24202)
Nifty Bank : 57262
Technical Outlook
Day that was :
Bank Nifty settled the nifty weekly expiry session on negative note at 57262 down 0.41%.
Te chnical Outlook :
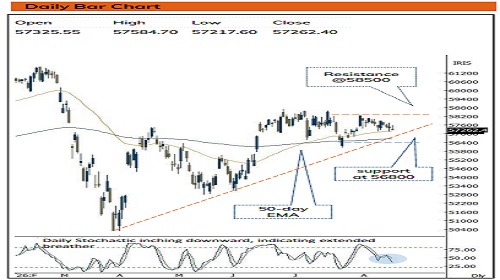
• Index started the day on a negative note, However, supportive efforts from 50 days EMA helped index to recoup some intraday losses. As a result, the daily price action formed is Inside bar within previous session Doji like candle, indicating extended consolidation.
• Lack of follow through buying and failure to close above previous session high has resulted into prolongation of consolidation. The index is undergoing healthy consolidation as over past 11 sessions index has merely retraced 50% of preceding seven session rally (56023-58248) yet managed to sustain above its 50 day, 100 day and 200 days EMA. This healthy consolidation would set the stage to resolve higher and challenge the upper band of consolidation placed at 58500 in the coming week. In the process, strong support is placed around 56800 being the placement of four months rising trendline coincided with 100 days EMA
• Another observation is that over last 7 weeks Index has retraced by 38.2% of earlier 3 weeks rally, indicating slower pace of retracement which would help to set stage for next leg of rally.
• The PSU Bank Index has formed a bear candle within previous session range while sustaining above 20 days EMA, indicating healthy consolidation. Going ahead, follow through strength above last week week (8857) high would open the door for next leg of up move towards 9100 levels
Intraday Rational :
• Trend - Prolongation of consolidation in vicinity of 57500, indicating positive bias
• Levels : Buy around Monday’s low.
Please refer disclaimer at https://secure.icicidirect.com/Content/StaticData/Disclaimer.html
SEBI Registration number INZ000183631