320-x-100_uti_gold.jpg" alt="Advertisement">

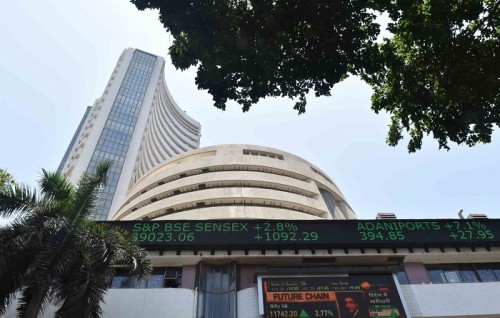
Bank Nifty started the week on a flat note, and buying momentum throughout the week - Axis Securities

Follow us Now on Telegram ! Get daily 10 - 12 important updates on Business, Finance and Investment. Join our Telegram Channel
Nifty
Nifty started the week on a flat note, and buying momentum throughout the week led it to close on a strong note. Nifty closed at 21457 on 15th December with a gain of 487 points on a weekly basis.
On the weekly chart, the index has formed a long bullish candle, forming a higher high-low compared to the previous week, and has also closed above the same, indicating a positive bias. The index is moving in a higher top and higher bottom formation on the daily chart, indicating a positive bias. The chart pattern suggests that if Nifty crosses and sustains above the 21600 level, it would witness buying, which would lead the index towards 21700-21800 levels. An important support for the week is around 21300-21000. Nifty is trading above 20, 50, 100, and 200-day SMAs, which are important short-term moving averages, indicating a positive bias in the short to medium term. Nifty continues to remain in an uptrend in the medium term, so buying on dips continues to be our preferred strategy. For the week, we expect Nifty to trade in the range of 21800-21000 with a positive bias.
The weekly strength indicator RSI is above its respective reference lines, indicating a positive bias.
The trend-deciding level for the day is 21395. If NIFTY trades above this level, then we may witness a further rally up to 21555-21650-21810 levels. However, if NIFTY trades below 21395 levels, then we may see some profit booking initiating in the market, which may correct up to 21295-21140-21040 levels.

Bank Nifty
Bank Nifty started the week on a flat note, and buying momentum throughout the week led it to close on a strong note. Bank Nifty closed at 48144 on 15th December with a gain of 882 points on a weekly basis
On the weekly chart, the index has formed a bullish candle, forming a higher high-low formation indicating a positive bias. Since the index broke out of the consolidation zone between 46380-42570, it is expected to move with positive momentum. The chart pattern suggests that if Bank Nifty crosses and sustains above the 48250 level, it would witness buying, which would lead the index towards 48500-48600 levels. However, if the index breaks below the 48000 level, it would witness selling, which would take the index towards 47800-47600. Bank Nifty is trading above 20, 50, 100, and 200-day SMAs, which are important short-term moving averages, indicating a positive bias in the short to medium term. Bank Nifty continues to remain in an uptrend in the short term, so buying on dips continues to be our preferred strategy. For the week, we expect Bank Nifty to trade in the range of 48600-47600 with a positive bias.
The weekly strength indicator RSI is above its respective reference lines, indicating a positive bias.
The trend-deciding level for the day is 48000. If BANKNIFTY trades above this level, then we may witness a further rally up to 48365-48585-48950 levels. However, if BANKNIFTY trades below 48000 levels, then we may see some profit booking initiating in the market, and it may correct up to 47780-47410-47190 levels..

For More Axis Securities Disclaimer https://simplehai.axisdirect.in/disclaimer-home
SEBI Registration number is INZ000161633


Tag News

Indian markets to deliver positive returns for 9th year in a row, outperform US


More News

Nifty oscillated in a narrow range on the budget day and settled marginally lower - Religare...