Weekly Technical Outlook - On the monthly time frame we can see that the NIFTY FMCG By GEPL Capital

Follow us Now on Telegram ! Get daily 10 - 12 important updates on Business, Finance and Investment. Join our Telegram Channel
Observation
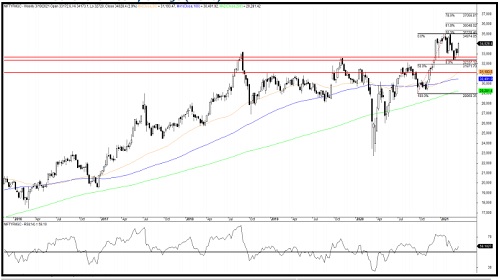
* On the monthly time frame we can see that the NIFTY FMCG has been forming a higher top high bottom pattern since April 2020.
* On the weekly time frame we can see the prices forming a higher high higher low for the past 4 weeks after bouncing off from the support cluster.
* In the week that passed by the index gained momentum and ended the week with a gain of 2.9% and strongly outperformed the Nifty.
* On the indicator front the RSI plotted on the long medium and the short time frame can be seen rising and sustaining above 55 mark, indicating the presence of bullish momentum in the prices.
* The long term moving averages on the daily time frame are as follows 50 Day SMA (33787), 100 Day SMA (33013) and 200 Day SMA (31723). Currently the index is placed above all the long term moving averages.
* The key technical levels to watch for on the upside are 34978-35330 (Recent swing high and 50% extension level of the rise from 28969-34978 projected form 32329) and 36040 (61.8% extension level of the rise from 28969-34978 projected form 32329) and eventually towards 37055 (78.6% extension level of the rise from 28969-34978 projected form 32329)
* On the downside the 32312 (Recent swing low) is the key level to watch for, If the prices manage to move below this level we might see the index move lower towards the 30500 (Multiple touch point level).
NIFTY FMCG: 34028 weekly change (2.9%)
Observation
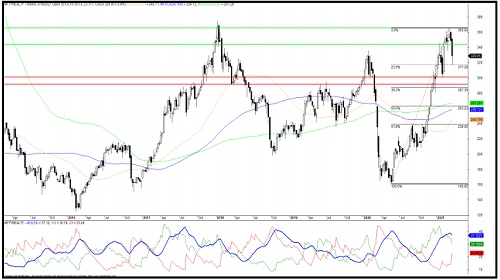
* NIFTY REALTY on the monthly time frame continues to maintain the higher high higher low pattern since April 2020.
* On the weekly time frame we can see that the index faced rejection near the 370 mark and has been moving for the past 2 weeks.
* In the last week, the index tested a fresh 6 week low, and ended the with a loss of (-5.81%).
* The ADX plotted on the weekly time frame can be seen moving lower as the prices fall, indicating lack of strength in the down move.
* On the daily time frame we can see the prices broke the double top neckline on Thursday and moved lower.
* The long term moving averages on the daily time frame are as follows 50 Day SMA (340), 100 Day SMA (305) and 200 Day SMA (258). Currently the prices are placed below the 20 Day SMA but remain above the 100 and the 200 Day Moving average which shows Up trend has turned to weaken.
* Going ahead the key levels to watch for on the downside are 317 (weekly low), followed by 304-301(support cluster).
* The crucial resistance is placed at 344 (Multiple touch point level) followed by 365 (Recent swing high).
NIFTY REALTY: 329.05 weekly change (-5.81%)
To Read Complete Report & Disclaimer Click Here
To Know More Details Visit GEPL Capital
SEBI Registration number is INH000000081.
Please refer disclaimer at https://geplcapital.com/term-disclaimer
Views express by all participants are for information & academic purpose only. Kindly read disclaimer before referring below views. Click Here For Disclaimer


More News

Daily Market Commentary 14 January 2022 By Mr. Siddhartha Khemka, Motilal Oswal