320-x-100_uti_gold.jpg" alt="Advertisement">

Weekly Technical Market Outlook - Nifty opened the week at 16530.70, made a high of 16610.95 By Jainam Share Consultant

Follow us Now on Telegram ! Get daily 10 - 12 important updates on Business, Finance and Investment. Join our Telegram Channel
Nifty
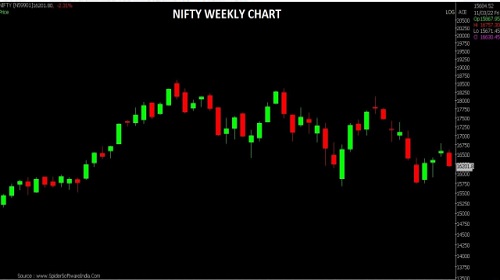
* Nifty opened the week at 16530.70, made a high of 16610.95, lowof 16172.60andclose the week at 16201.80 Thus, Nifty closed the week with a loss of 382.50points on weekly basis.
* On the weekly chart, Nifty started the week on a negative note and continueditsprevious week’s bearish momentum to end the week on a negativenote. Theindex has formed a decent bearish candle, as a follow-through to theprecedingweek’s Shooting Star kind of formation, is acting as some sort of confirmationforthe resumption of the down move. The overall trading range for index for comingweek would be 16500 - 16000, either side breakout will lead the trend.
* On the daily chart, the index has formed a Bearish candle forming Lowerlowcompare to previous session indicating negative bias. The chart patternsuggeststhat if Nifty crosses and sustains above 16325 level it would witness buyingwhichwould lead the index towards 16484-16610 levels. However if index breaksbelow16172 level it would witness selling which would take the index towards15928-15738.
Banknifty
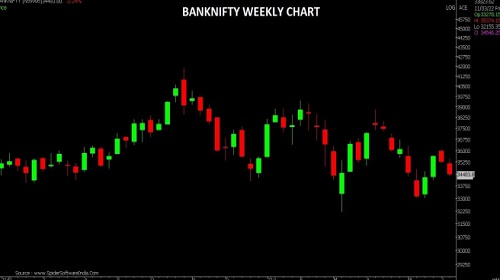
* Banknifty opened the week at 35159.15 made a high of 35449.90 lowof 34346.65and closed the week at 34483.80 Thus, Banknifty close the week withaLossof791.25 points on weekly basis.
* On the weekly chart, Banknifty opened the week with a downward gapandsellingpressure throughout the session led it to close in negative territory. Theindexhasformed a bearish candle indicating weakness at current levels. The overall tradingrange for Banknifty would be 34400 - 35000 either side breakout will leadthetrend.
* On the daily chart, the index has formed a bearish candle indicatingsellingatcurrent levels. The index is currently trading at its previous breakout zoneof 34400level and if it breaks this level then we will witness more pain in comingdays. Thechart pattern suggests that if Banknifty crosses and sustains above 35178level itwould witness buying which would lead the index towards 35603 - 36066levels.However if index breaks below 34340 level it would witness selling whichwouldtake the index towards 34000 - 33750
Sensex
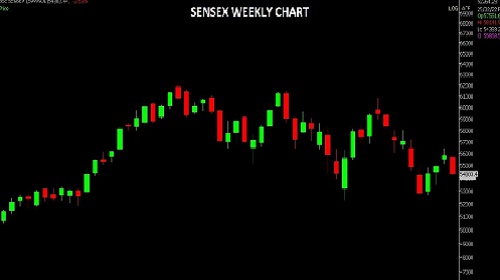
* Sensex opened the week at 55610.64 made a high of 55832.28, lowof 54205.99and close the week at 54303.44 Thus, Sensex close the week with a loss of 1465.79points on weekly basis.
* On the weekly chart, Sensex started the week on a negative note and continueditsweek's in bearish momentum to end the week on negative note. Theindexhasformed bearish candle forming lower High-Low compare to previous weekandhasclosed below previous week low.
* On the daily chart, the index has formed a long Bearish candle indicatingsellingathigher levels. The chart pattern suggests that if Sensex crosses and sustainsabove54936 level it would witness buying which would lead the index towards55431-56156 levels. However if index breaks below 54190 level it wouldwitnessselling which would take the index towards 53716 - 52778.
To Read Complete Report & Disclaimer Click Here
Please refer disclaimer at https://jainam.in/
SEBI Registration No.: INZ000198735, Research Analyst: INH000006448, PMS: INP000006785
Views express by all participants are for information & academic purpose only. Kindly read disclaimer before referring below views. Click Here For Disclaimer


Tag News

Nifty opened with an upward gap and witnessed consolidation for most part of the session - J...


More News

Nifty could now test the next important supports of 21860-21777 in the near term - HDFC Secu...