Weekly Technical Outlook - In the previous week the BANKING sector strongly outperformed By GEPL Capital
Follow us Now on Telegram ! Get daily 10 - 12 important updates on Business, Finance and Investment. Join our Telegram Channel
NIFTY PSU BANK: 2277.95 weekly change (25.6%)
Observation
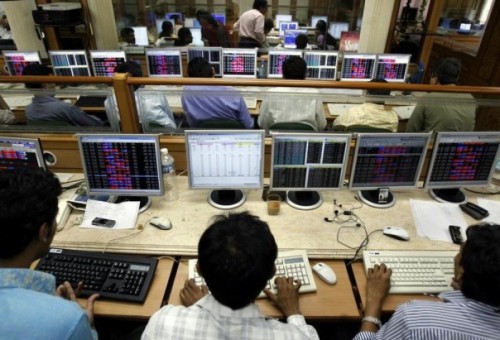
* In the previous week the BANKING sector strongly outperformed the NIFTY. The PSU banks were the out performers among the banking space. In the week that passed by the PSU BANK ended the week with a massive gain of 25%.
* The MACD plotted on the weekly time frame can be seen moving above the zero line for the first time since August 2019, indicating that the trend has turned strongly bullish for the first time since August 2019. The RSI rising on the long and the medium term charts shows expanding momentum in the bullish trend.
* On the daily time frame as well the Index has given a breakout of rising channel pattern forming since Nov 2020 which has ultimate space till 2550 - 2600 mark.
* The long term moving averages on the daily time frame are as follows 20 Day SMA (1840), 100 Day SMA (1581) and 200 Day SMA (1478). Currently the PSU bank index is placed above all the averages.
* The key technical levels to watch for on the upside are 2596-2684 (Multiple touch point zone and rising channel pattern target) and 2868 (Multiple touch point zone).
* On the Downside the 2000 (multiple touch points and previous swing high) is the key level to watch for, If the prices manage to sustain below this level we might see the index move lower towards the 1815 (Weekly low).
Inference & Expectations
* Nifty PSU BANK witnessed a strong rally after the Union Budget 2021.
* The Long term and the medium term charts show that the long and the medium term bullish trend is still intact.
* Going ahead we can expect the upward rally to be continue which will take the NIFTY PSU BANK Index till 2550—2600 mark followed by 2684 and 2868 levels.
* If the Index closes and sustains below the 2000 mark our bullish view will be negated and we can expect further downside towards 1815 mark.

NIFTY FINANCIAL SERVICES: 16724 weekly change (14.6%)
Observation
* NIFTY FINANCIAL SERVICES Index on the monthly time frame can be seen forming a higher high higher low pattern and testing fresh life time high.
* On the weekly time frame the Index formed a strong bullish candle and strongly outperformed the NIFTY by ending the week with a gain of (14.60%).
* The MACD plotted on the medium and the short time frame can be seen placed above the zero line, indicating that the trend is bullish on the medium and the short time frame. Similarly the RSI on the both the time frame rising, indicates expanding bullish momentum in the up trend
* On the daily time frame the Index has maintained Higher Top Higher Bottom formation and ended near the life time high. The long term moving averages on the daily time frame are as follows 20 Day SMA (15571), 100 Day SMA (13527) and 200 Day SMA (12006). Currently the prices are trading above all the long term moving averages.
* The crucial resistance is placed at 17240 (50% extension level of the rise from 10114-15848 projected from 14373) followed by 17917 (61.8% extension level of the rise from 10114-15848 projected from 14373)
* Going ahead the key technical levels to watch for on the downside are 15848 (11th Jan high), beyond which we might see a test of 14732 (Weekly low).
Inference & Expectations
* The NIFTY FINANCIAL SERIVES Index witnessed a strong bounce back after testing the lows of 14373 mark.
* The simple bar chart analysis of the long and medium term charts say that the Index is in a strong bull phase on the long and the medium time frame.
* Going ahead we can expect the NIFTY FINANCIAL SERIVES Index to test the 17240 on the upside, if it sustain above this level then it will move towards the 17917 mark.
* If the prices break below the 15848 levels then our bullish view will be negated, post which we can expect a further down move towards the 14732 mark.

To Read Complete Report & Disclaimer Click Here
To Know More Details Visit GEPL Capital
SEBI Registration number is INH000000081.
Please refer disclaimer at https://geplcapital.com/term-disclaimer
Views express by all participants are for information & academic purpose only. Kindly read disclaimer before referring below views. Click Here For Disclaimer


