Weekly Commodity Outlook Of 30-01-2021 By Swastika Investmart

Follow us Now on Telegram ! Get daily 10 - 12 important updates on Business, Finance and Investment. Join our Telegram Channel
FUNDAMENTALS OF COMMODITY:
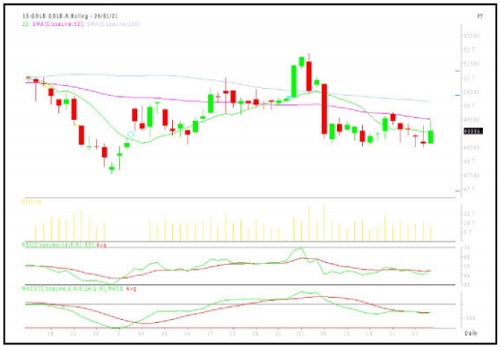
Gold
Gold and silver futures prices are trading sharply higher in early U.S. trading Friday, with silver hitting a three-week high. Safehaven demand for the precious metals is in play heading into the weekend, amid a wobbly U.S. stock market and _ keen uncertainty regarding the GameStock/Reddit matter. Global stock markets were mostly weaker overnight. U.S. stock indexes are pointed toward lower openings when the New York day session begins. It’s been a very interesting week on Wall Street.
Technical indicators (Weekly):
* RSI- 46.16
* MACD- -317.74
* MOVING AVERAGES (20,50,100)-(49043/49505/50139)
MCX GOLD CHART

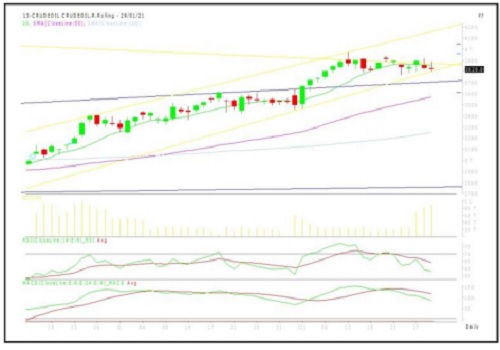
Crude oil
Crude oil prices settled lower Friday for the second straight week on fears the rocky ride for demand will continue as the threat of new Covid-19 variants prolonging the pandemic remains. Top U.S. infectious disease specialist Anthony Fauci said the Johnson & Johnson’s vaccine news was ‘very encouraging” in controlling Covid-19, though he added that the highly transmissible variants were a “wake up call" for the public. The weak end to the day for oil prices, however, has done little to sway Wall Street conviction in the "bull thesis" for energy in the wake of the Saudi Arabia's production cuts.
Technical indicators (Daily):
* RSI- 58.19
* MACD- +85.99
* MOVING AVERAGES (20,50,100)- (3853/3570/3249)
MCX CRUDE OIL CHART

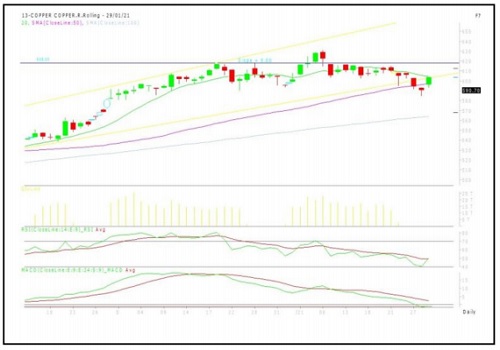
Copper
Copper prices continued to slump on Friday, hitting their lowest point of the month amid a global sell-off in equities and a firmer US dollar, which made greenback-priced metals less appealing to holders of other currencies. Weaker equities also hurt risk sentiment across asset classes and raised concerns about liquidity in financial markets.
Technical indicators (Daily):
* RSI- 50.27
* MACD- -1.13
* MOVING AVERAGES (20,50,100) - (604.42/597.48/564.06)
MCX COPPER CHART

To Read Complete Report & Disclaimer Click Here
Please refer disclaimer at https://www.swastika.co.in/disclaimer
Views express by all participants are for information & academic purpose only. Kindly read disclaimer before referring below views. Click Here For Disclaimer


 320-x-100_uti_gold.jpg" alt="Advertisement">


