Weekly Commodity Outlook Of 29-03-2021 By Swastika Investmart

Follow us Now on Telegram ! Get daily 10 - 12 important updates on Business, Finance and Investment. Join our Telegram Channel
FUNDAMENTALS OF COMMODITY:
* WTI oil prices increased 3.9% to $60.82 per barrel and Brent crude increased 4.1% to $64.48 per barrel over concerns that the Suez Canal blockage may last weeks and tighten supply. On Thursday, officials stopped all ships entering the shipping lane and a salvage company said the vessel may take weeks to free. Despite Friday’s rebound, oil prices declined during the week and booked their third consecutive weekly loss, with both benchmarks dropping nearly 3% over demand concerns stemming from rising coronavirus cases in multiple regions of the world.
* Spot gold prices increased 0.4% to $1,731.3 per ounce, but the metal declined 0.7% in the week and booked its first weekly loss in three. “Factors that would normally weigh on gold, such as rising stock markets and the firm U.S. dollar, do not appear to be pressuring its price all that much at present.” On the macro front, the USD increased after PCE figures showed that personal income fell less than expected, whereas spending declined at a faster pace and prices point to tame inflation. Meanwhile, the 10-year Treasury yield rose to 1.665%.
* China’s economic rebound continued in March, as factory activities accelerated amid strong global orders and recovering domestic demand, leading to a surge in producer prices. Strong factory activity momentum is also partly reflected by the jump in producer prices, with Bloomberg’s tracker showing prices surging 5% in March from a year earlier, the fastest increase since December 2017. This could add further pressure to the global inflation outlook, as demand for China-made goods is set to climb after the U.S. rolled out the latest $1.9 trillion stimulus showed.
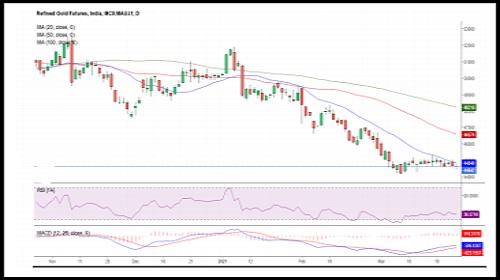
Technical indicators (Daily):
* RSI- 36.5710
* MACD- -506.8387
* MOVING AVERAGES (20,50,100)- (44839.5/46573.84/48218.27)
MCX GOLD CHART
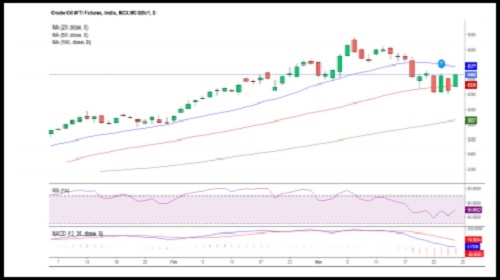
Technical indicators (Daily):
* RSI- 47.8895
* MACD- 93.7553
* MOVING AVERAGES (20,50,100)- (4620/4244/3775)
MCX CRUDE OIL CHART
MCX COPPER CHART
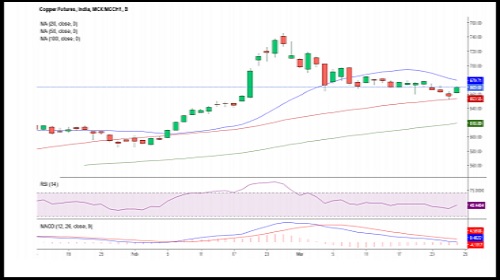
Technical indicators (Daily):
* RSI- 49.4404
* MACD- 0.4822
* MOVING AVERAGES (20,50,100) - (679.71/653.55/618.89)
To Read Complete Report & Disclaimer Click Here
Please refer disclaimer at https://www.swastika.co.in/disclaimer
Views express by all participants are for information & academic purpose only. Kindly read disclaimer before referring below views. Click Here For Disclaimer