Weekly Commodity Outlook Of 25-04-2021 By Swastika Investmart

Follow us Now on Telegram ! Get daily 10 - 12 important updates on Business, Finance and Investment. Join our Telegram Channel
https://t.me/InvestmentGuruIndiacom
Download Telegram App before Joining the Channel
FUNDAMENTALS OF COMMODITY
* Oil futures regained ground on Friday, with WTI crude settling above the $62 a barrel level after upbeat economic data for the US, including PMIs and new homes sales, lifted hopes of a fast recovery in fuel demand. In Europe, flash PMIs also pointed to economic recovery, and some countries, including France, start to ease restrictions. Still, rising coronavirus infections in some parts of Asia capped gains. As a result, the US benchmark finished the week almost 2% lower while Brent ended it down 1%.
* Silver was little changed at $26.2 an ounce on Friday, close to levels not seen in one month, and is set for a 3rd straight week of gains, amid a slightly weaker dollar and falling Treasury yields. The Silver Institute expects global silver demand to rise 15% this year and prices may top 30% to an average annual price of $27.30. Demand from the auto sector is likely to increase as well as modern cars are using more silver than ever in their advanced technology components.
* The copper market extended its upward momentum into April, with front-month futures climbing above $4.3 per pound towards its highest since 2011 as speedy vaccination rollouts and trillions in dollars of economic stimulus lifted hopes of a robust global economic recovery and higher demand for metals. A slew of data, including better-than-expected US preliminary PMI readings, reinforced this view, while President Biden’s multitrillion-dollar infrastructure plan lent further optimism to the copper bulls. Adding to the chipper mood, banks like Goldman Sachs and Citi lifted their bets on copper consumption this year, focusing on its longer-term role in a carbon-free world.
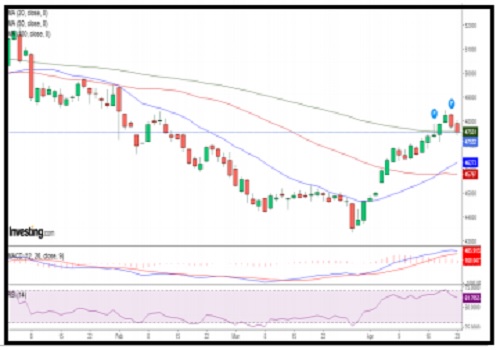
Technical indicators (Daily):
* RSI- 61.7055
* MACD- 645.9632
* MOVING AVERAGES (20,50,100)- (46273/45797/47551)
MCX GOLD CHART
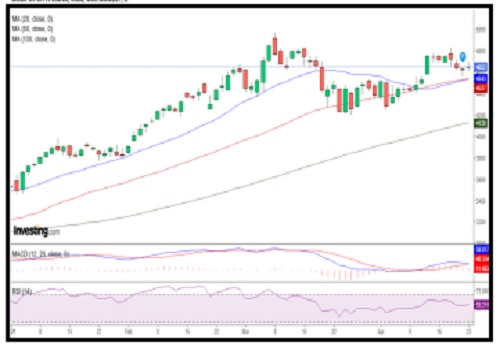
Technical indicators (Daily):
* RSI- 55.2119
* MACD- 59.8177
* MOVING AVERAGES (20,50,100)- (4543/4536/4129)
MCX CRUDE OIL CHART
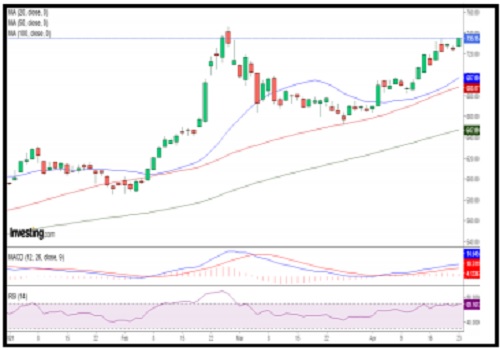
Technical indicators (Daily):
* RSI- 69.1612
* MACD- 14.6455
* MOVING AVERAGES (20,50,100) - (697.09/688/648.08)
MCX COPPER CHART
To Read Complete Report & Disclaimer Click Here
Please refer disclaimer at https://www.swastika.co.in/disclaimer
Views express by all participants are for information & academic purpose only. Kindly read disclaimer before referring below views. Click Here For Disclaimer