320-x-100_uti_gold.jpg" alt="Advertisement">

USDINR July futures inch towards 79 as the pair closed to an all-time high level in the past week - HDFC Securities

Follow us Now on Telegram ! Get daily 10 - 12 important updates on Business, Finance and Investment. Join our Telegram Channel
Recovery in Risk-Assets to support Asian Currencies
* A risk-on environment, weaker dollar index and lower commodity prices bode well for Indian Rupee. A gauge of the dollar’s strength posted its first weekly decline in a month as US equities rose, with traders paring back ratehike bets due to growing recession concerns and falling inflation expectations. Risk reversals on the dollar index are the least bullish in three weeks amid growing demand for both euro and yen calls.
* In the week gone, spot USDINR gained 27 paise or 1/3rd percentage points to 78.34. The pair made a life high of 78.38 before settling at 78.34. The sentiments remain bullish for the pair but near-term profit booking can’t be ruled out ahead of the quarter-end rebalancing. Technically, the pair is having support at 77.70 and resistance at 78.80. ● The University of Michigan’s final June reading of longer-term US consumer inflation expectations settled back to 3.1% from an initially reported 14-year high of 3.3%, potentially reducing the urgency for steeper Federal Reserve interest-rate hikes.
* Elsewhere, recession fears have pushed the oil price down to $109 a barrel from $121 just two weeks ago, a 9% drop.
* AS per CFTC reporting, the flows were pretty mixed in forex markets. Speculators sold euros (9.6k) and CAD (19.1k), but bought yen (11.3k), sterling (2.3k), AUD (2.6k), and kiwi (1.4k.) In aggregate, the dollar long rose by about $1.3 billion on the week.
Technical Observations:
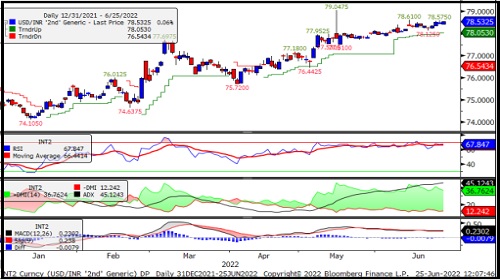
* USDINR July futures inch towards 79 as the pair closed to an all-time high level in the past week.
* The pair has been trading well above a super trend line indicating the continuation of an up trend.
* Momentum oscillators, Relative Strength Index of 14 days oscillating near overbought zone and currently placed at 68.
* MACD is placed above zero line but with negative crossover indicating a weakening of an uptrend.
* Long build-up has been seen with a rise in price and open interest.
* The bias remains bullish as long as USDINR July futures holds 78 while on the higher side it could face resistance around 79.
USDINR July Daily Chart
Technical Observations:
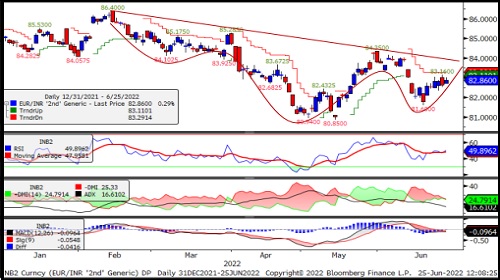
* EURINR July futures is in formation wide inverse head and shoulder pattern of five months with neckline resistance around 84.
* The pair is having resistance at 83.29, the super trend line on a daily chart.
* Momentum oscillator, Relative Strength Index of 14 days given positive cross over and placed at 50 with upward direction indicating positivity.
* MACD has given positive cross-over and heading towards zero line along with a positive histogram bar.
* Long build-up has been seen with a rise in price, open interest and volumes.
* EURINR July futures could show a positive trend once it trades above 83.30 and head towards 84 while on the downside falling below 82 will negate the said view.
EURINR July Daily Chart
Technical Observations:
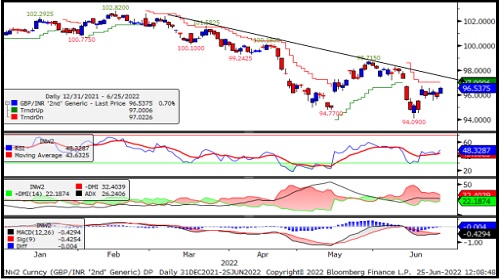
* GBPINR July futures is having super trend resistance at 97.02 and the descending trend line resistance around 97.50.
* It has been trading above short-term moving averages.
* The pair is forming a bullish flag pattern on the hourly chart with a poll of 94.09 to 96.66 and a flag of 96.66 to 95.50.
* Momentum oscillator, relative strength index of 14 days period given positive divergence and currently placed at 48 indicating positive momentum in the near term.
* However, MACD has been placed below the zero line with a negative crossover indicating a weak trend.
* GBPINR July futures is expected to trade higher and a crossing of 96.70 will open for a 97 to 97.50 range while on the downside it has support around 95.50.
GBPINR July Daily Chart
Technical Observations:
* JPYINR July futures has been trading well below short-term moving averages.
* It is forming a bearish sequence of lower top lower bottom on major time frames.
* The pair is having resistance at 60.70, the super trend line.
* Momentum oscillator, Relative strength index of 14 days exited from the oversold zone with positive divergence indicating a near-term reversal. However, the price confirmation is needed and will be above the 59.90 level.
* Directional movement index is indicating negativity with +DI placed below –DI and ADX line approaching is also declining.
* JPYINR July futures is expected to trade lower with support at 57.60 and resistance at 59.90.
JPYINR July Daily Chart

To Read Complete Report & Disclaimer Click Here
Please refer disclaimer at https://www.hdfcsec.com/article/disclaimer-1795
SEBI Registration number is INZ000171337
Views express by all participants are for information & academic purpose only. Kindly read disclaimer before referring below views. Click Here For Disclaimer


Tag News

EURINR trading range for the day is 89.13 - 89.49. - Kedia Advisory