The weekly price action formed a significant bull candle carrying higher high-low, indicating acceleration of upward momentum - ICICI Direct

Follow us Now on Telegram ! Get daily 10 - 12 important updates on Business, Finance and Investment. Join our Telegram Channel
Index to extend the rally led by Cyclicals…
Technical Outlook
* In line with our view (‘Monthly Technical Strategy’- May), Nifty resolved higher and surpassed the lifetime high of 15400. The weekly price action formed a significant bull candle carrying higher high-low, indicating acceleration of upward momentum.
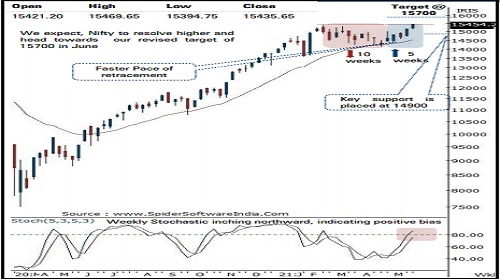
* We expect, Nifty to resolve higher and head towards our revised target of 15700 in June, as it is 123.6% external retracement of February-April correction (15432-14151). Our constructive stance on the market is based on: a) Key point to highlight is that, index has entirely retraced past 10 weeks corrective move (15432-14151) in just 5 weeks. Faster pace of retracement signifies structural improvement that augurs well for next leg of up move b) The current up move (1050 points) off May low of 14416 is larger in magnitude compared to last two up moves of ~900 points seen in last three months. The elongated up moves followed by shallow retracement supported by improving market breadth signifies robust price structure
* After ~900 points rally over past 10 sessions, temporary breather from higher levels cannot be ruled out. However, such breather should be capitalised to accumulate quality stocks. Meanwhile, Nifty small cap index is expected to challenge life highs
* Sectorally, BFSI, IT, Infra and Consumption are expected to lead the rally. Auto and Metals provide favourable risk-reward
* We prefer Infosys, Kotak Bank, Reliance Industries, Dmart, M&M, Titan in large caps while, Mindtree, Grindwell, EIH, Endurance, Bata India, Thermax ,are preferred in Midcap category
* Nifty midcap and small cap indices endured their winning spree and clocked fresh 52 weeks high. The outperformance in the broader market indices has been backed by improving market breadth as currently ~85% of index components are trading above their 50 days EMA compared to April reading of ~60%. We expect, small cap index to challenge the all time high which is just 3% away
* Structurally, the formation of higher high-low signifies elevated buying demand that makes us confident to revise support base at 14900 as it is confluence of: a) 80% retracement of past 2 weeks rally (1472-15470), at 14875 b) 50 days EMA is placed at 14825 In the coming session, the index is likely to open on a subdued note tracking muted Asian cues. We expect Nifty futures to trade with a positive bias while maintaining higher high-low formation. Hence, use intraday dip towards 15385-15412 to create long for target of 15498.
NSE Nifty Weekly Candlestick Chart
Nifty Bank: 35141
Technical Outlook
* The weekly price action formed a bull candle with a lower shadow, indicating continuation of the up move and a buying demand at lower levels near the recent breakout area and the April high (34287 ) .
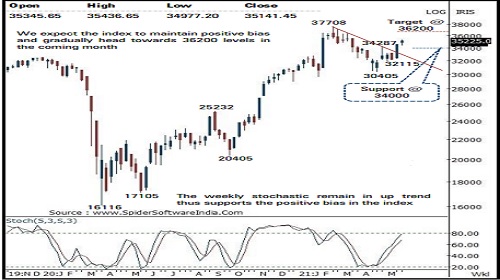
* Going forward, we reiterate our positive stance with target of 36200 in coming month as it is the confluence of the 80 % retracement of the entire last three months corrective decline (37708-30405) and the price parity with previous up move (30405-34287) as projected from the recent trough of 32115 signalling upside towards 36200 levels .
* Key observation is that the index since April has maintained the rhythm of not correcting for more than two to three sessions . During previous week, also the index rebounded after two sessions of breather . Extended rally and shallow correction highlights positive price structure
* As mentioned in earlier edition the index has recently registered a breakout above the falling supply line joining major highs of the last three months as can be seen in the adjacent chart highlighting resumption of the primary up trend
* The formation of higher high -low on the weekly chart signifies elevated buying demand that makes us confident to revise the support base higher towards 34000 levels as it is confluence of the 38 . 2 % retracement of the current up move (32115 -35463 ) and the recent breakout area and the April high (34287 )
* Among the oscillators, the weekly stochastic remain in uptrend and is currently placed at a reading of 76 thus supports the continuation of the positive bias in the index in the coming weeks
* In the coming session, the index is likely to open on a flat to negative note amid muted global cues . We expect the index to trade with positive bias and maintain higher high -low . Hence use dips towards 35080 -35150 for creating long position for the target of 35410 , maintain a stoploss of 34970
Nifty Bank Index – Weekly Candlestick Chart
To Read Complete Report & Disclaimer Click Here
https://secure.icicidirect.com/Content/StaticData/Disclaimer.html
Views express by all participants are for information & academic purpose only. Kindly read disclaimer before referring below views. Click Here For Disclaimer


Tag News

Stock Picks : TCS Ltd And Chambal Fertiliser Ltd By ICICI Direct


More News

The India VIX index is at 14.68 vs 13.71, ATM CE IV 14.00 & PE IV 15.88 - Axis Securities