The trend deciding level for the day is 35270 - Axis Securities

Follow us Now on Telegram ! Get daily 10 - 12 important updates on Business, Finance and Investment. Join our Telegram Channel
Nifty
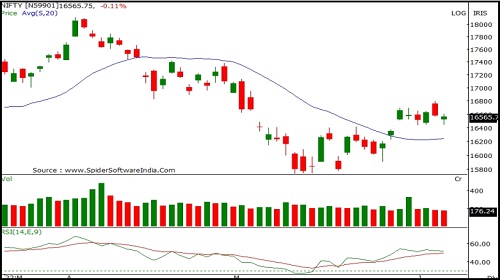
Nifty opened lower with a downward gap and remained lackluster within a narrow trading range throughout the session. Nifty closed at 16570 with a loss of 15 points.
On the daily chart the index has formed a Bullish candle with a long lower shadow indicating buying at lower levels. The index is moving in a Higher Top and Higher Bottom formation on the daily chart indicating a sustained up trend. The chart pattern suggests that if Nifty crosses and sustains above 16600 level it would witness buying which would lead the index towards 16700-16800 levels. However if the index breaks below 16500 level it would witness selling which would take the index towards 16400-16300. Nifty is trading above its 20 day SMA which indicates positive bias in the short term. Nifty continues to remain in an uptrend for the short term, so buying on dips continues to be our preferred strategy
The daily strength indicator RSI has turned positive from the oversold territory and is above its reference line indicating positive bias.
The trend deciding level for the day is 16540. If NIFTY trades above this level then we may witness a further rally up to 16640-16710-16805 levels. However, if NIFTY trades below 16540 levels then we may see some profit booking initiating in the market, which may correct up to 16470-16375-16305 levels.
Bank Nifty
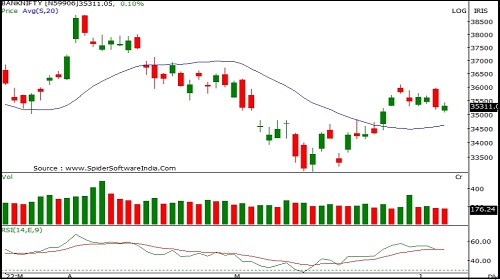
Banknifty opened with a downward gap and traded with extreme volatility on either side. Banknifty closed at 35310 with a gain of 35 points.
On the daily chart index has formed a small bullish candle carrying shadows on the either side indicating indecision at current levels.The index is moving in a Higher Top and Higher Bottom formation on the daily chart indicating a short term up trend. The chart pattern suggests that if Banknifty crosses and sustains above 35400 level it would witness buying which would lead the index towards 35800-36000 levels. However if index breaks below 35000 level it would witness selling which would take the index towards 34800-34500. Banknifty is trading above 20 day SMA's indicating positive bias in the short to medium term. Banknifty continues to remain in an uptrend in the medium and long term, so buying on dips continues to be our preferred strategy.
The daily strength indicator RSI has turned positive from oversold and is above its reference line indicating sustained strength.
The trend deciding level for the day is 35270. If BANK NIFTY trades above this level then we may witness a further rally up to 35465-35620-35820 levels. However, if BANK NIFTY trades below 35270 levels then we may see some profit booking initiating in the market, which may correct up to 35115-34915-34760 levels.
To Read Complete Report & Disclaimer Click Here
For More Axis Securities Disclaimer https://simplehai.axisdirect.in/disclaimer-home
SEBI Registration number is INZ000161633
Views express by all participants are for information & academic purpose only. Kindly read disclaimer before referring below views. Click Here For Disclaimer


Top News

Astro Zindagi (Weekly Horoscope)


More News
Opening Bell : Domestic indices likely to get flat-to-positive start on Monday