The index started the week with a positive gap (17670-17791) and achieved our target of 18100. However - ICICI Direct

Follow us Now on Telegram ! Get daily 10 - 12 important updates on Business, Finance and Investment. Join our Telegram Channel
Buy on dips, Nifty expected to hold 17400 in truncated week…
Technical Outlook
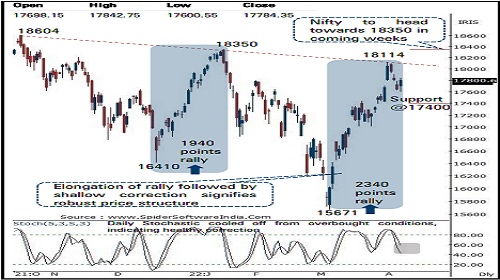
• The index started the week with a positive gap (17670-17791) and achieved our target of 18100. However, profit booking from higher levels dragged the index below the 18000 mark. As a result, weekly price action formed a Doji candle, indicating a breather after a sharp rally. In the process, broader markets outperformed benchmarks and accelerated their catch up activity
• The index is resuming its uptrend after undergoing healthy retracement post 1100 points rally seen in just six sessions. This has helped the index to cool off overbought conditions. Key point to highlight is that the rallies are getting elongated followed by shallow corrections (not >3% in the ongoing rally), highlighting robust price structure. The current rally is supported by significant improvement in market breadth along with multi sector participation, which makes us confident to believe the index will resolve higher and challenge recent high of 18100 and eventually head towards January high of 18350 in coming weeks. Thus, temporary breather from here on should be capitalised on as incremental buying opportunity as we do not expect strong support of 17400 to be breached
• Sectorally, IT will be in focus amid earnings while positive stance maintained in BFSI, PSU, Auto, Metals and Telecom
• Our preferred large cap picks are Reliance Industries, TCS, Axis Bank, Asian Paints, Bajaj Finance, Tata Motors, Tata Steel, ITC while Voltas, HAL, Bank of Baroda , Birla Soft, SRF, Graphite, Timken, Lemon tree, TCI Express are preferred in midcap category
• On expected lines, broader market indices accelerated catch up activity with its large cap peers. The current up move of ~18% in Midcap is larger in magnitude compared to December-January up move of 14%. Further, this rally is backed by improving market breadth as the percentage of stocks above 50-DMA of the Nifty 500 universe has soared to 78% compared to mid February (Russian invasions on Ukraine) swing high reading of 25%, indicating inherent strength that augurs well for durability of ongoing up move going ahead.
• Structurally, the formation of higher peak and trough on the weekly chart supported by improving market breadth signifies rejuvenation of upward momentum that makes us confident to retain support base at 17400 mark as it is 61.8% retracement of current up move (17004- 18114), placed at 17428 In the coming session, index is likely to open on a subdued note tracking mixed global cues. We expect index to hold Friday’s low of 17650 and pose a bounce post initial blip. Hence, use intraday dips towards 17710-17740 for creating long position for target of 17827
NSE Nifty Daily Candlestick Chart
Nifty Bank: 37752
Technical Outlook
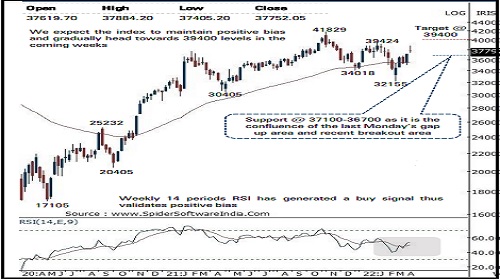
• The weekly price action formed a Doji candle with shadows in either direction which maintained higher high -low signaling continuation of the overall positive bias . The index started the week on a strong note and achieved our target of 38400 . However, profit booking at higher levels saw the index gave up some of its gains and closed the week below 38000 levels .
• Going ahead we expect the index to continue with its up move and gradually head towards February 2022 high of 39400 levels in the coming weeks • Buy on dips strategy has worked well during the recent up move, which is likely to continue, hence the current breather of the last 3 - 4 sessions should not be seen as negative instead should be used as buying opportunity as we do not expect Nifty to breach support area of 37100 -36700 being the confluence of the following observations :
• (a) Monday’s bullish gap up area placed around 37100
• (b) The recent breakout area above last two weeks high is placed around 36700 levels
• In the smaller time frame the index has already taken four sessions to retrace just 38 . 2 % of the preceding six sessions up move (35016 -38765 ) . A shallow retracement signals a higher base formation and an overall positive price structure
• Among the oscillators the weekly 14 periods RSI has recently generated a buy signal moving above its nine periods average thus validates overall positive bias in the index In the coming session, index is likely to witness negative opening tracking soft global cues . Post initial blip we expect supportive efforts to emerge from near Friday’s low of 37566 . Hence use intraday dips towards 37510 -37580 for creating long position for target of 37840 , maintain a stop loss at 37390
Nifty Bank Index – Weekly Candlestick Chart
To Read Complete Report & Disclaimer Click Here
https://secure.icicidirect.com/Content/StaticData/Disclaimer.html
Views express by all participants are for information & academic purpose only. Kindly read disclaimer before referring below views. Click Here For Disclaimer


Tag News

Stock Picks : TCS Ltd And Chambal Fertiliser Ltd By ICICI Direct


