The index recovered most of the initial losses in the first half of the session - ICICI Direct

Follow us Now on Telegram ! Get daily 10 - 12 important updates on Business, Finance and Investment. Join our Telegram Channel
Nifty: 18113
Technical Outlook
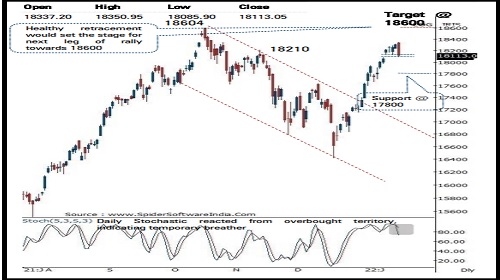
• The index recovered most of the initial losses in the first half of the session. However, fag end sell-off hauled the Nifty below past four session low (18120). As a result, daily price action formed a bear candle that engulfed past four sessions trading range, indicating pause in upward momentum
• Going ahead, we expect the index to undergo healthy retracement after ~1000 points rally seen during CY22 that hauled daily stochastic oscillator in overbought territory (which was placed at 96 in last session). We believe ongoing breather amid stock specific action would make market healthy and pave the way for next leg of up move toward life time high of 18600. In the process, we do not expect Nifty to breach the key support threshold of 17800. Therefore, extended breather from here on should not be construed as negative, instead dips should be capitalized as an incremental buying opportunity
• In tandem with benchmark, the broader market indices underwent profit booking. Nifty small cap index clocked yet another fresh all time high, nevertheless failed to sustain at higher levels. We believe, ongoing breather would make broader market healthy and gradually accelerate their relative outperformance in coming weeks.
• Structurally, the formation of higher peak and trough on the weekly and monthly chart signifies elevated buying demand, that makes us confident that ongoing breather would find its feet around 17800 as it is confluence of: a) 61.8% retracement of CY22 up move (17383-18350), placed at 17752 b) Since May 2020 on multiple occasions 20 days EMA acted as an intermediate support during primary up trend. Currently it is placed at 17800 c) Last week’s low is placed at17879 In the coming session, the index is likely to open on a flat note amid muted global cues. We expect volatility to remain high owing to volatile global cues. The index is likely to witness range bound activity while sustaining above psychological mark of 18000. Hence use intraday dip towards 18052-18078 for creating long position for target of 18167
NSE Nifty Daily Candlestick Chart
Nifty Bank: 38210
Technical Outlook
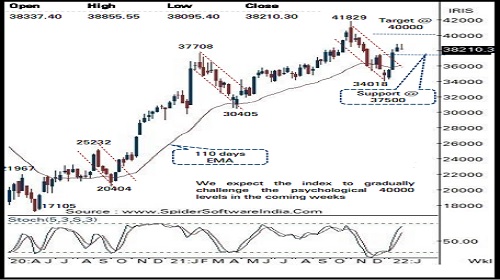
• The price action over past two sessions has led to an inverted hammer like candle on weekly chart as prices failed to sustain 38850 which is last week’s high and also 61 . 8 % Fibonacci retracement of November -December decline (41829 -34018 ) . Price action over past four sessions reflect a marginal profit booking or breather after almost 4000 points rally since beginning of CY22 .
• Going forward, our structural positive stance on BankNifty remains intact with next target of 40000 expected in the run - up to the Union Budget 2022 , which is the 80 % retracement of the entire decline (41829 -34018 )
• Index has resumed its uptrend after 20 % correction during November -December 2021 . In early January 2022 index resolved out of falling channel signaling end of corrective phase . Further relative ratio of BankNifty/Nifty has also resolved above falling trend line indicating outperformance by Banking index in coming weeks, as anxiety around impact of third covid wave subsided . Therefore, any breather in coming week should not be construed negative rather would offer incremental buying opportunity as we enter the Q 3 earnings season . Buying the decline strategy should work well in coming earnings season as we expect BankNifty index to hold strong support of 37500 levels being the confluence of the following technical observations :
• (a) 23 . 6 % retracement of the current up move (34018 -38851 ) (b) the recent breakout area is placed around 37500 levels
In the coming session, the index is likely to open on a flat note amid muted global cues . We expect Nifty bank to endure its relative outperformance while sustaining above past three sessions low of 38110 . Hence use intraday dip towards 38150 - 38220 for creating long position for target of 38465 , maintain a stoploss at 38035
Nifty Bank Index – Weekly Candlestick Chart
To Read Complete Report & Disclaimer Click Here
https://secure.icicidirect.com/Content/StaticData/Disclaimer.html
Views express by all participants are for information & academic purpose only. Kindly read disclaimer before referring below views. Click Here For Disclaimer





Tag News

Stock Picks : TCS Ltd And Chambal Fertiliser Ltd By ICICI Direct


 320-x-100_uti_gold.jpg" alt="Advertisement">


