320-x-100_uti_gold.jpg" alt="Advertisement">

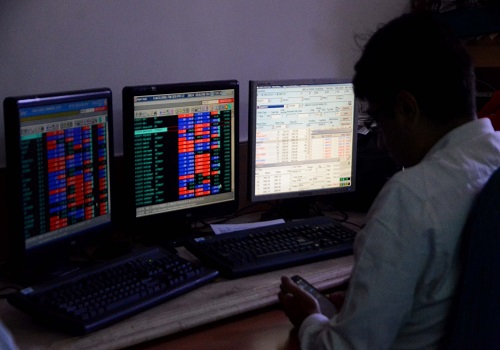
The index formed a hammer like candle as gradual recovery from early lows indicated - ICICI Direct

Follow us Now on Telegram ! Get daily 10 - 12 important updates on Business, Finance and Investment. Join our Telegram Channel
Nifty : 19434
Technical Outlook
• The index formed a hammer like candle as gradual recovery from early lows indicated presence of buying demand in the vicinity of 100-day ema placed at 19250. Index however needs to exhibit follow through strength above Monday’s high and upper band of declining trend line from July highs placed at 19600 to indicate meaningful recovery
• We believe, past three week’s slower pace of retracement (four weeks rally of 18646-19991retraced by merely 50%) has made market healthy. The lack of faster retracement on either side and end of earnings season indicate prolongation of ongoing consolidation in the broader range of 19900-19200 with stock specific action
• Key point to highlight since June 2022 is that, index has not witnessed negative candles for more than 3-4 weeks in a row. In current scenario, we expect index to maintain the same rhythm of time wise correction as Nifty has already corrected over past three weeks. Thus, buying on dips would be the prudent strategy as key support is placed at 19200 levels.
• Structurally, secondary correction is the part of the secular bull market. Thus dips should not be construed as negative, instead it should be used as incremental buying opportunity as we believe ongoing healthy retracement would find its feet around key support of 19200 being confluence of:
• a) 61.8% retracement of current up move (18645-19991), at 19160
• b) 50 days EMA is placed at 19242
• c) July month’s low is placed at 19234
• On the broader market front, the midcap index has continued to clock new All Time High over 12th weeks in a row, highlighting strength. However, past five months remarkable >30% rally hauled weekly stochastic oscillator in overbought territory while breadth indicator (% of stocks above 200 DMA) has approached overbought condition (placed at 91), suggesting impending consolidation

Nifty Bank: 44091
Technical Outlook
• The price action for the day formed a high wave candle describing intraday volatility and supportive efforts around rising 100 -day EMA
• Key point is after over three week decline index has approached key support zone around 43500 and maturity of price/time correction based on following key observations . We recommend buying dips with PSU banking space expected to outperform :
• 38 . 2 % retracement of entire rally since March 2023 lows (38613 -46369 )
• Value of rising 100 -day ema at 43829
• June swing low at 43345
• Time wise, since June 2022 lows index has not formed more than three consecutive bear candles . With three bear candles behind us we expect index to bounce back from key support
• PSU Banking index is at the cusp of multi year breakout and seen relatively outperforming . We expect this relative outperformance to further amplify in coming months

To Read Complete Report & Disclaimer Click Here
Please refer disclaimer at https://secure.icicidirect.com/Content/StaticData/Disclaimer.html
SEBI Registration number INZ000183631
Above views are of the author and not of the website kindly read disclaimer


Tag News

Weekly Market Analysis : Markets strengthened recovery and gained nearly 2% in the passing w...